Fig. 12.
Download original image
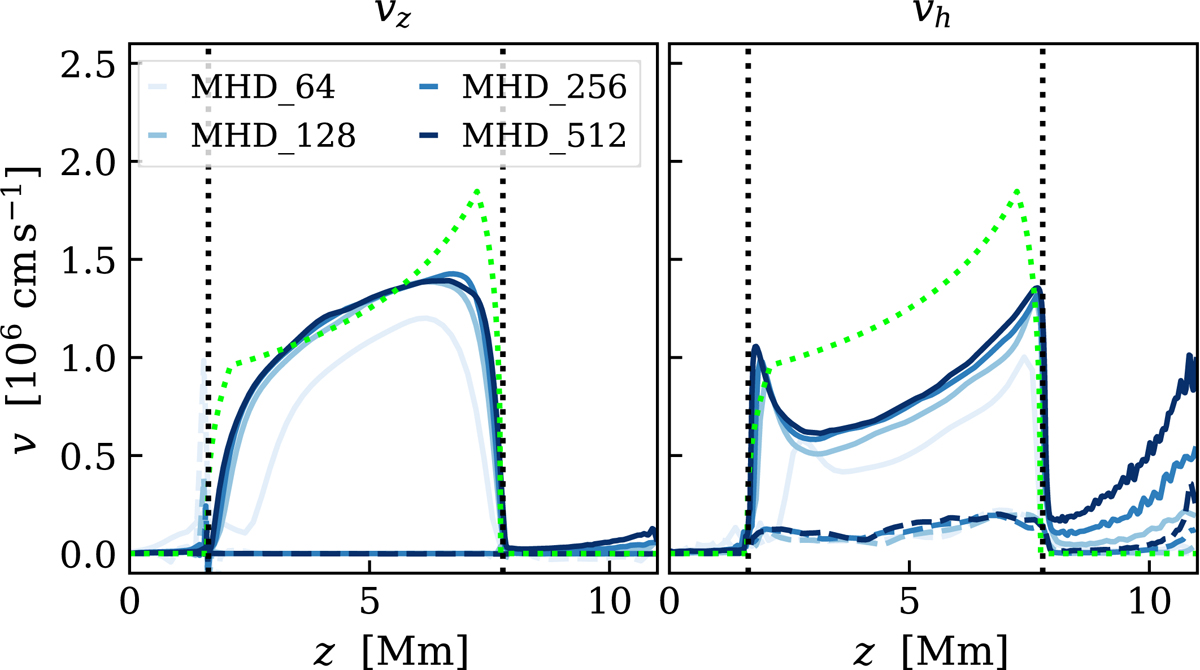
Vertical profiles of the vertical (left) and horizontal (right) components of the velocity field for the four MHD simulations. The rms profiles are shown in continuous lines, while dashed lines represent the mean profiles. Dotted vertical lines denote the boundaries of the convection zone. The MLT prediction for the one-dimensional dispersion velocity given by Eq. (8) is shown in green.
Current usage metrics show cumulative count of Article Views (full-text article views including HTML views, PDF and ePub downloads, according to the available data) and Abstracts Views on Vision4Press platform.
Data correspond to usage on the plateform after 2015. The current usage metrics is available 48-96 hours after online publication and is updated daily on week days.
Initial download of the metrics may take a while.