Fig. 10.
Download original image
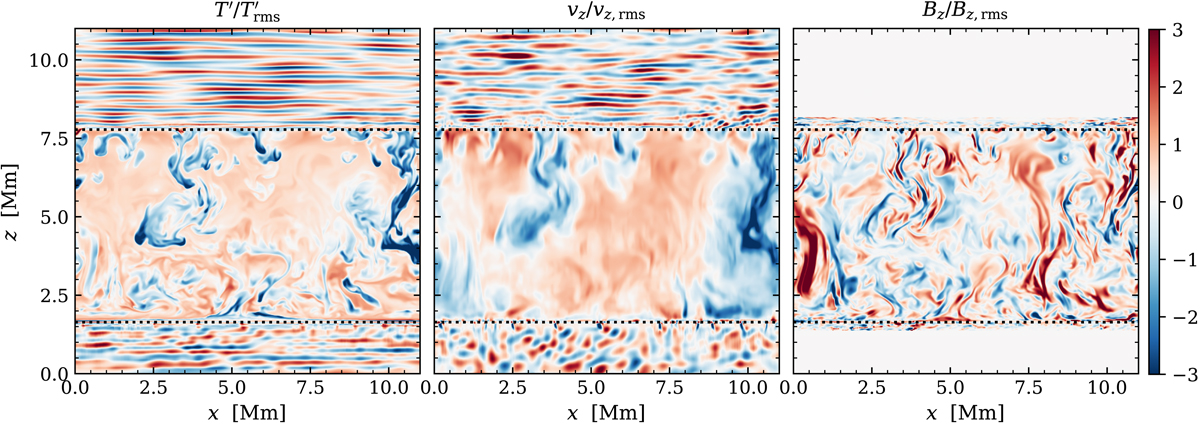
Vertical sections of the temperature fluctuations T′ (left), vertical velocity vz (middle), and vertical magnetic field Bz (right). To enhance the visibility of the perturbations, each quantity is scaled by its mean rms value at each height z. The sections are taken from the simulation MHD_512 at t = 5000 s and y = 2.34 Mm. Black dotted lines indicate the boundaries of the convection zone.
Current usage metrics show cumulative count of Article Views (full-text article views including HTML views, PDF and ePub downloads, according to the available data) and Abstracts Views on Vision4Press platform.
Data correspond to usage on the plateform after 2015. The current usage metrics is available 48-96 hours after online publication and is updated daily on week days.
Initial download of the metrics may take a while.