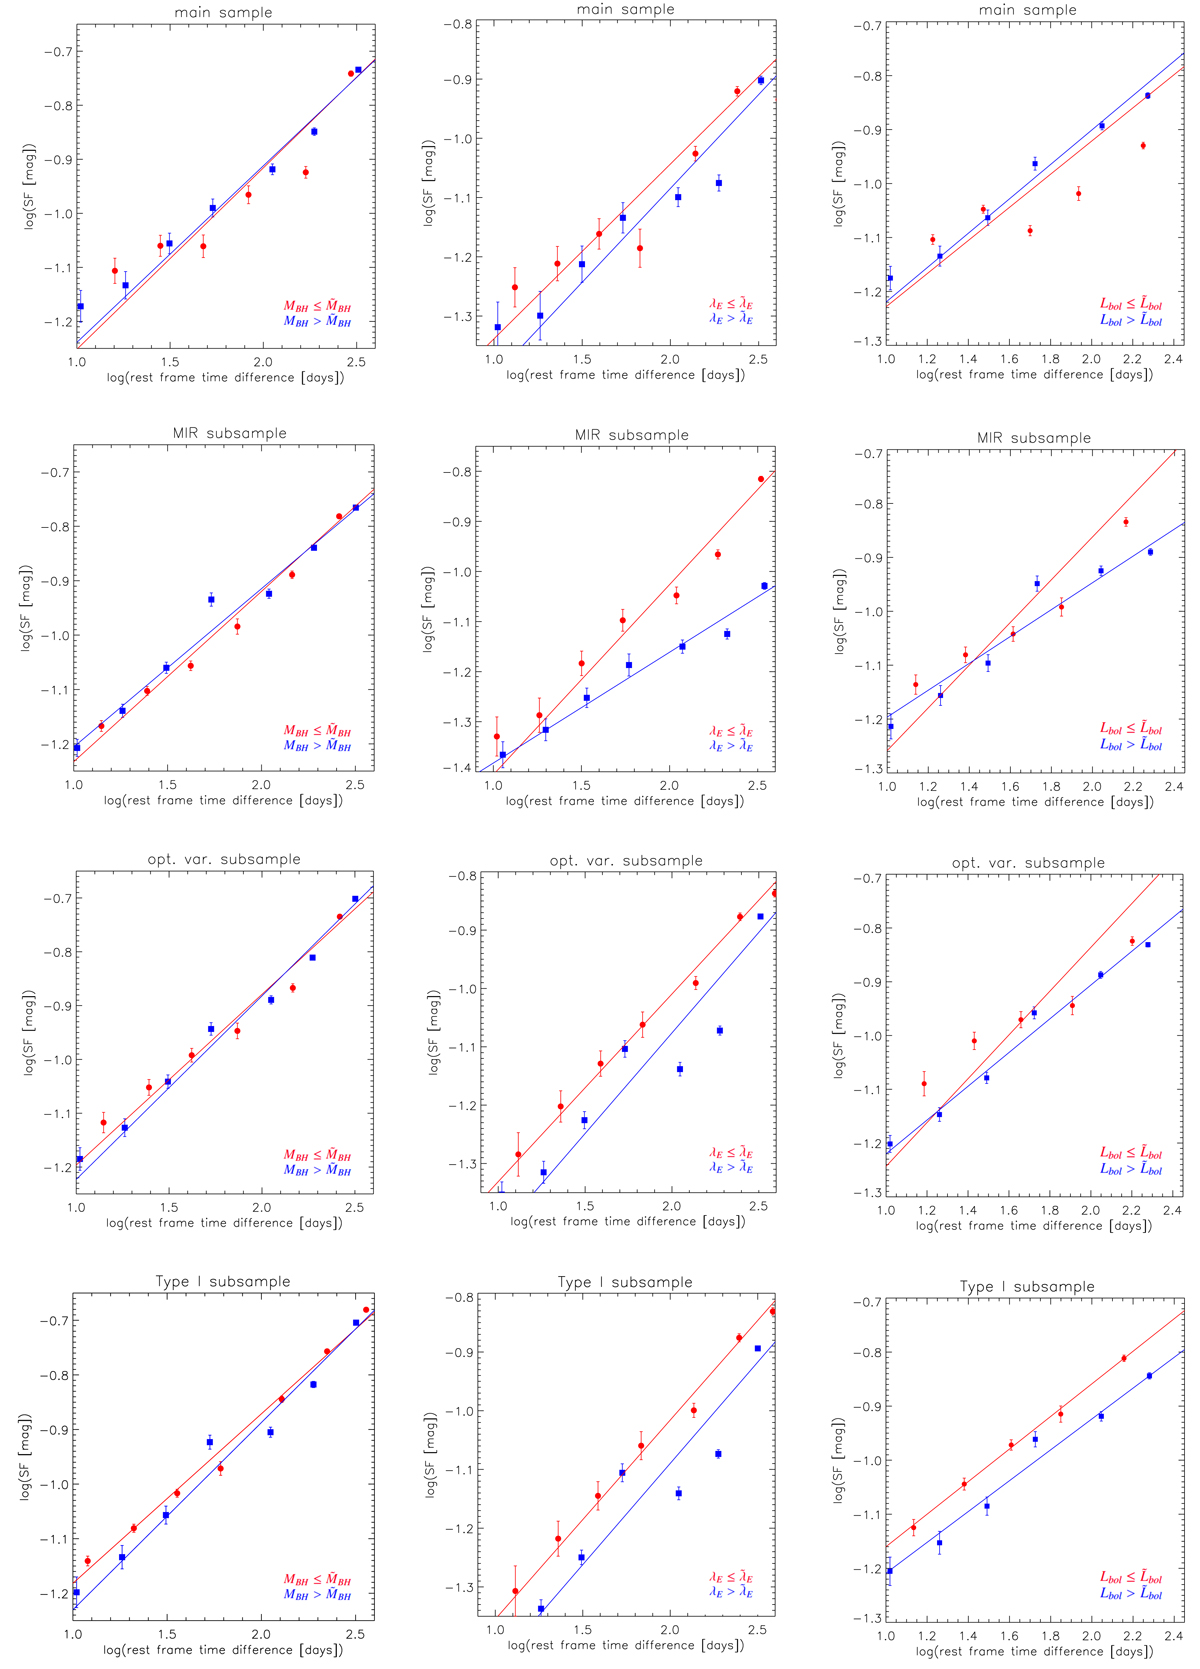
Fig. 9.
Download original image
Zoom on the linear region of the SF for the four samples of AGN selected to investigate possible dependencies on MBH (left column), λE (middle column), and Lbol (right column). The various panels show results for the main sample, MIR AGN, optically variable AGN, and Type I AGN (top to bottom lines). As in Fig. 8, in each panel we show the two subsets of sources delimited by the (logarithm of the) median value of the physical property of interest: red dots indicate the samples of sources with lower MBH/λE/Lbol values and blue squares indicate the sources with higher values. The represented rest-frame baseline corresponds to ≈10−400 days.
Current usage metrics show cumulative count of Article Views (full-text article views including HTML views, PDF and ePub downloads, according to the available data) and Abstracts Views on Vision4Press platform.
Data correspond to usage on the plateform after 2015. The current usage metrics is available 48-96 hours after online publication and is updated daily on week days.
Initial download of the metrics may take a while.