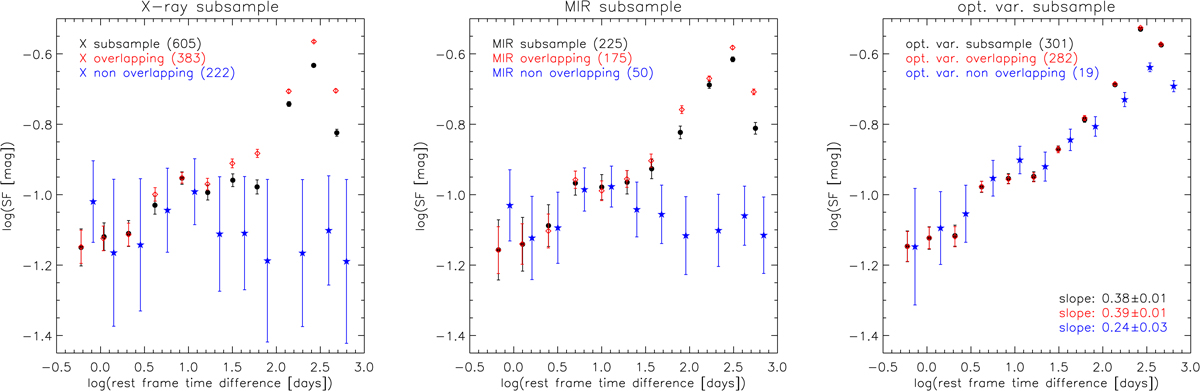
Fig. 6.
Download original image
SF of the three subsamples of AGN including a partition of sources not overlapping any other AGN subsamples: X-ray AGN (left), MIR AGN (center), optically variable AGN (right). Each subsample consists of two complementary subsets: one overlapping one or more AGN subsamples, and the other not overlapping any other AGN subsample. For each subsample we show the SF obtained from all of its sources (black dots), the SF of the overlapping subset (red diamonds), and the SF of the non-overlapping subset (blue stars). The panel corresponding to optically variable AGN includes estimates for the slope of the linear region of each SF, which can be identified in correspondence of the logarithmic range 1.0−2.6 for the baseline. The slopes are the best-fit lines computed via weighted least squares regression.
Current usage metrics show cumulative count of Article Views (full-text article views including HTML views, PDF and ePub downloads, according to the available data) and Abstracts Views on Vision4Press platform.
Data correspond to usage on the plateform after 2015. The current usage metrics is available 48-96 hours after online publication and is updated daily on week days.
Initial download of the metrics may take a while.