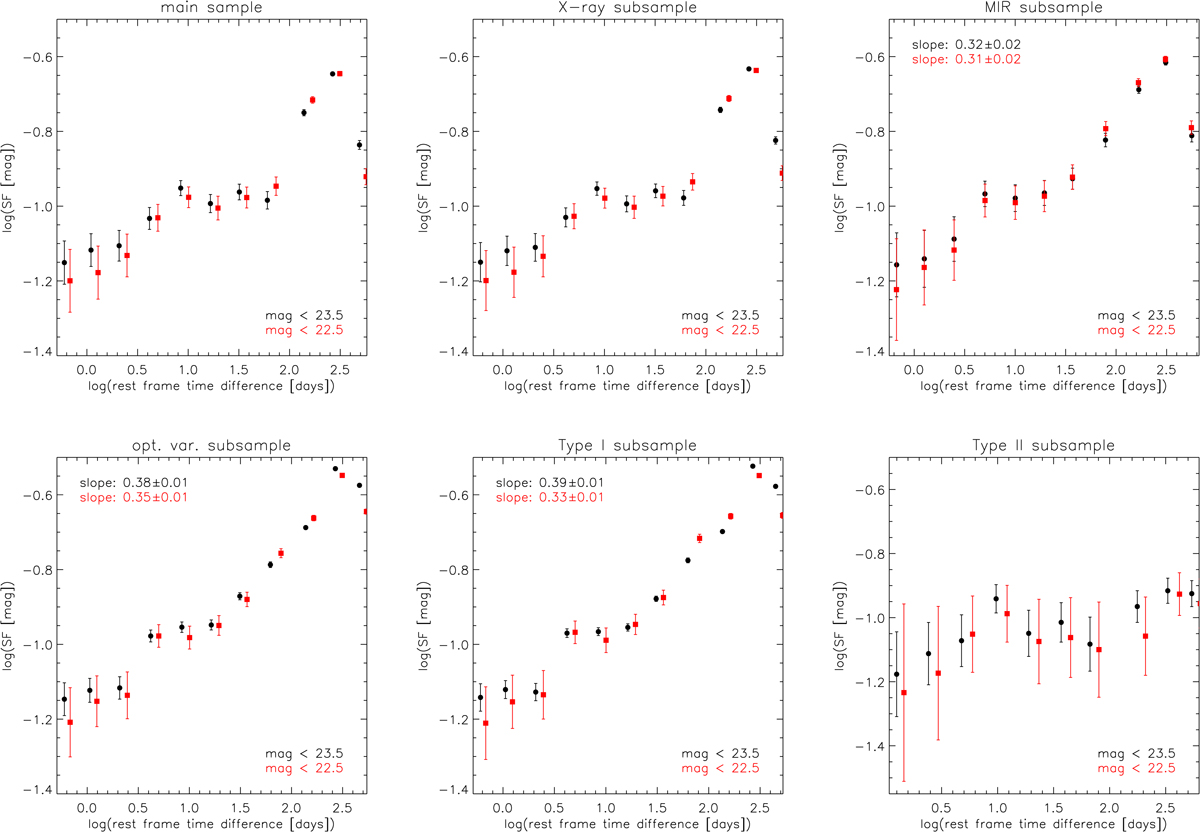
Fig. 5.
Download original image
SF of the six samples of AGN selected via different properties and investigated in this study: main sample (top left), X-ray AGN (top center), MIR AGN (top right), optically variable AGN (bottom left), Type I AGN (bottom center), and Type II AGN (bottom right). We tested two different magnitude thresholds: r < 23.5 mag (black dots) and r< mag (red squares). The ranges on both axes are roughly the same to ease comparison among the various samples and thresholds. The three panels corresponding to MIR, optically variable, and Type I AGN, where a clear linear region in the SF can be identified in correspondence of the logarithmic range 1.0−2.6 for the baseline, include estimates for the corresponding slopes, for each of the two adopted thresholds. The slopes are the best-fit lines computed via weighted least squares regression.
Current usage metrics show cumulative count of Article Views (full-text article views including HTML views, PDF and ePub downloads, according to the available data) and Abstracts Views on Vision4Press platform.
Data correspond to usage on the plateform after 2015. The current usage metrics is available 48-96 hours after online publication and is updated daily on week days.
Initial download of the metrics may take a while.