Open Access
Fig. 4.
Download original image
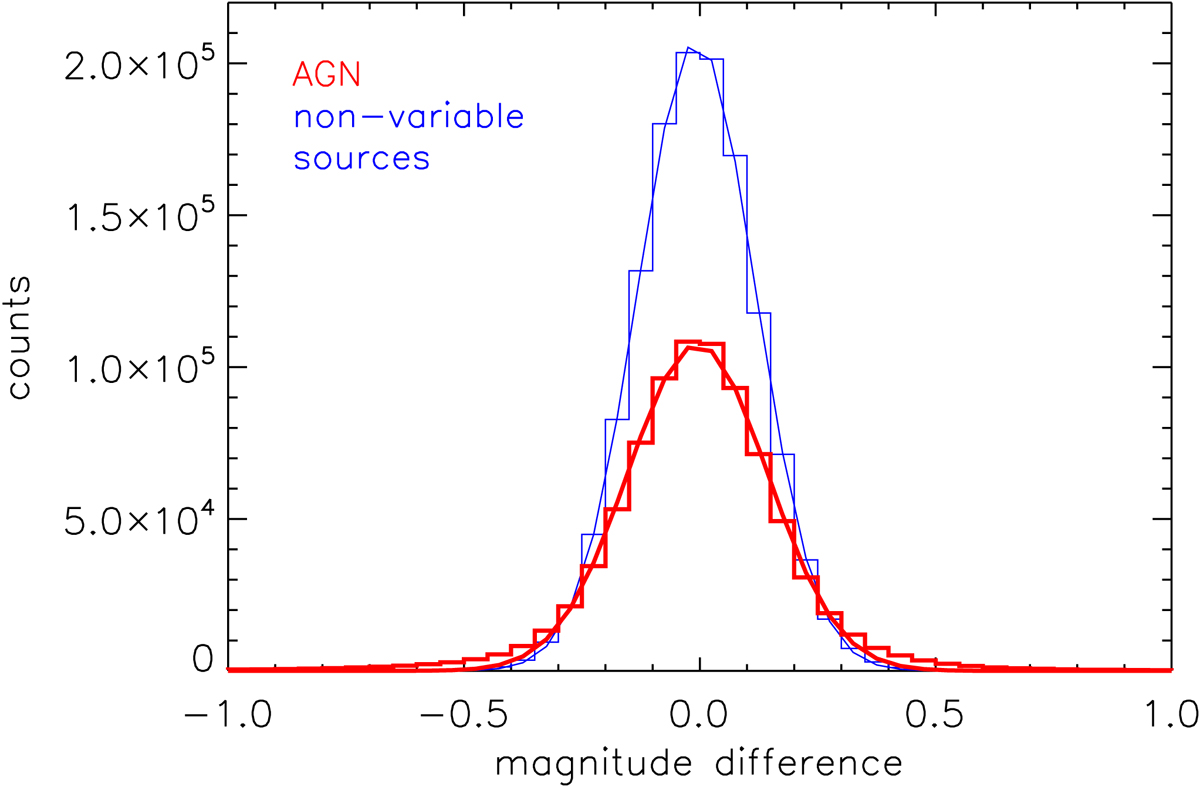
Distribution of the magnitude difference for our main sample (thick red) and for the sample of non-variable sources selected to estimate the noise contribution (thin blue). Each solid line represents the Gaussian fit for the corresponding distribution, computed via non-linear least squares.
Current usage metrics show cumulative count of Article Views (full-text article views including HTML views, PDF and ePub downloads, according to the available data) and Abstracts Views on Vision4Press platform.
Data correspond to usage on the plateform after 2015. The current usage metrics is available 48-96 hours after online publication and is updated daily on week days.
Initial download of the metrics may take a while.