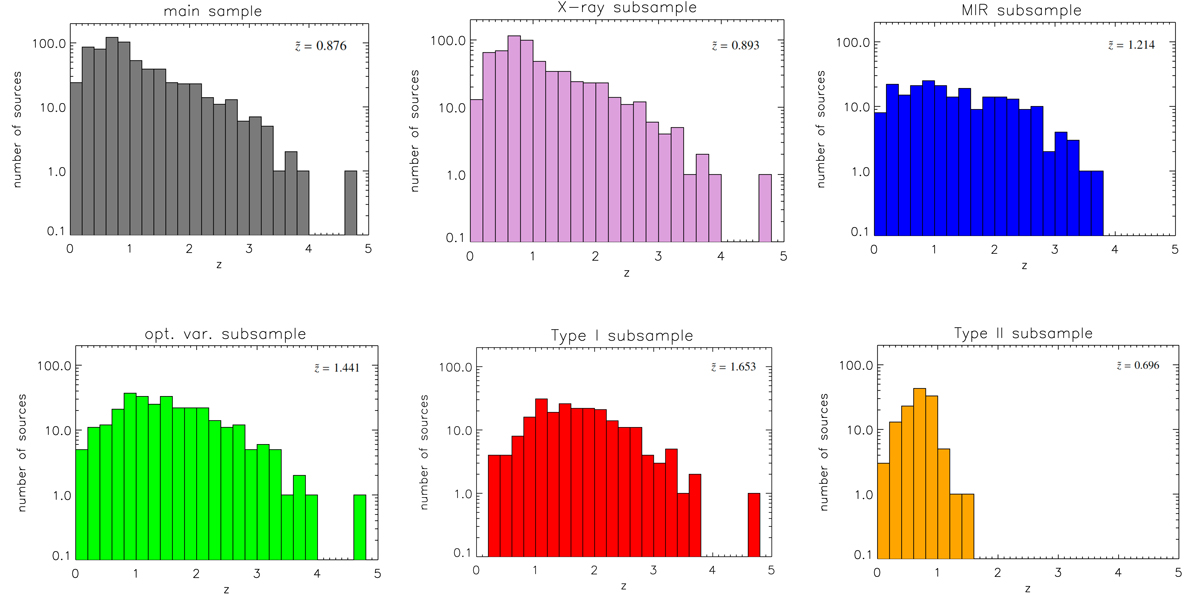
Fig. 3.
Download original image
Redshift distribution for the main sample of 677 AGN (top left), and for the five subsamples of AGN selected by means of different techniques: AGN selected via their X-ray properties (top center), AGN selected via their MIR properties (top right), AGN selected via optical variability (bottom left), and Type I and Type II AGN confirmed by spectroscopy (bottom center and bottom right, respectively). Each panel reports the median redshift value for the corresponding sample. Details about the selection criteria are reported in Sect. 2.
Current usage metrics show cumulative count of Article Views (full-text article views including HTML views, PDF and ePub downloads, according to the available data) and Abstracts Views on Vision4Press platform.
Data correspond to usage on the plateform after 2015. The current usage metrics is available 48-96 hours after online publication and is updated daily on week days.
Initial download of the metrics may take a while.