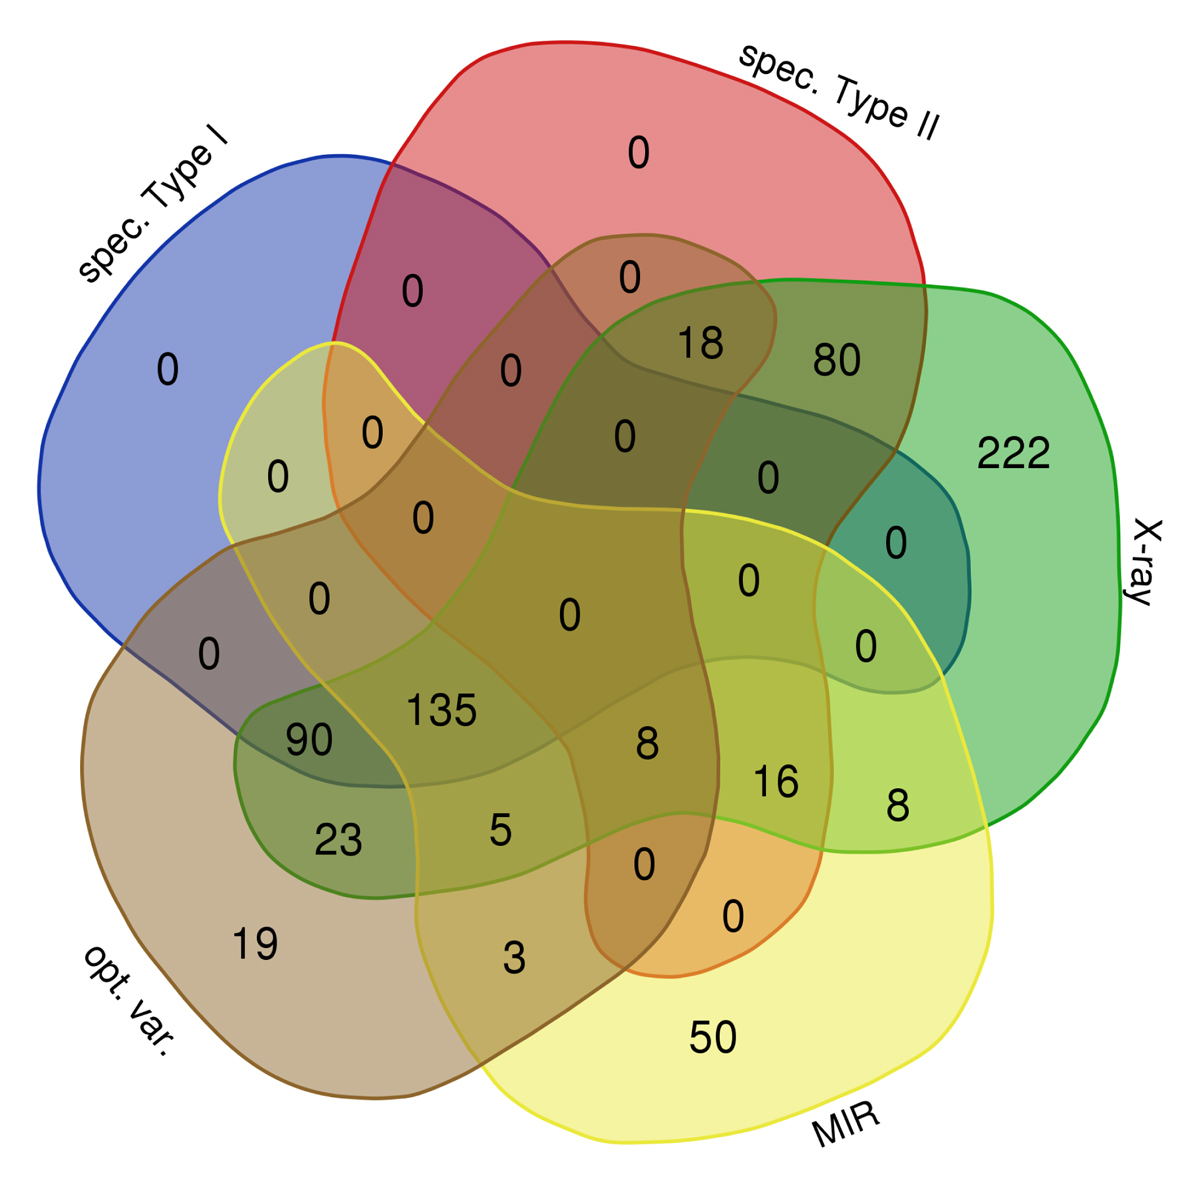
Fig. 2.
Download original image
Venn diagram showing: the subsamples of spectroscopically confirmed Type I and Type II AGN (spec. Type I, 225 sources, and spec. Type II, 122 sources, respectively; these two subsamples, by definition, do not overlap); the sample of sources classified as AGN on the basis of their X/O diagram (X-ray, 605 sources); the subsample of AGN selected after their MIR properties (Donley et al. 2012; MIR, 225 sources); and the subsample of objects classified as AGN based on their optical variability (De Cicco et al. 2021; opt. var., 301 sources). We caution that the area covered by each region and the corresponding number of sources are not related. These five subsamples of sources combined together constitute the main sample of AGN used in this study.
Current usage metrics show cumulative count of Article Views (full-text article views including HTML views, PDF and ePub downloads, according to the available data) and Abstracts Views on Vision4Press platform.
Data correspond to usage on the plateform after 2015. The current usage metrics is available 48-96 hours after online publication and is updated daily on week days.
Initial download of the metrics may take a while.