Fig. 10.
Download original image
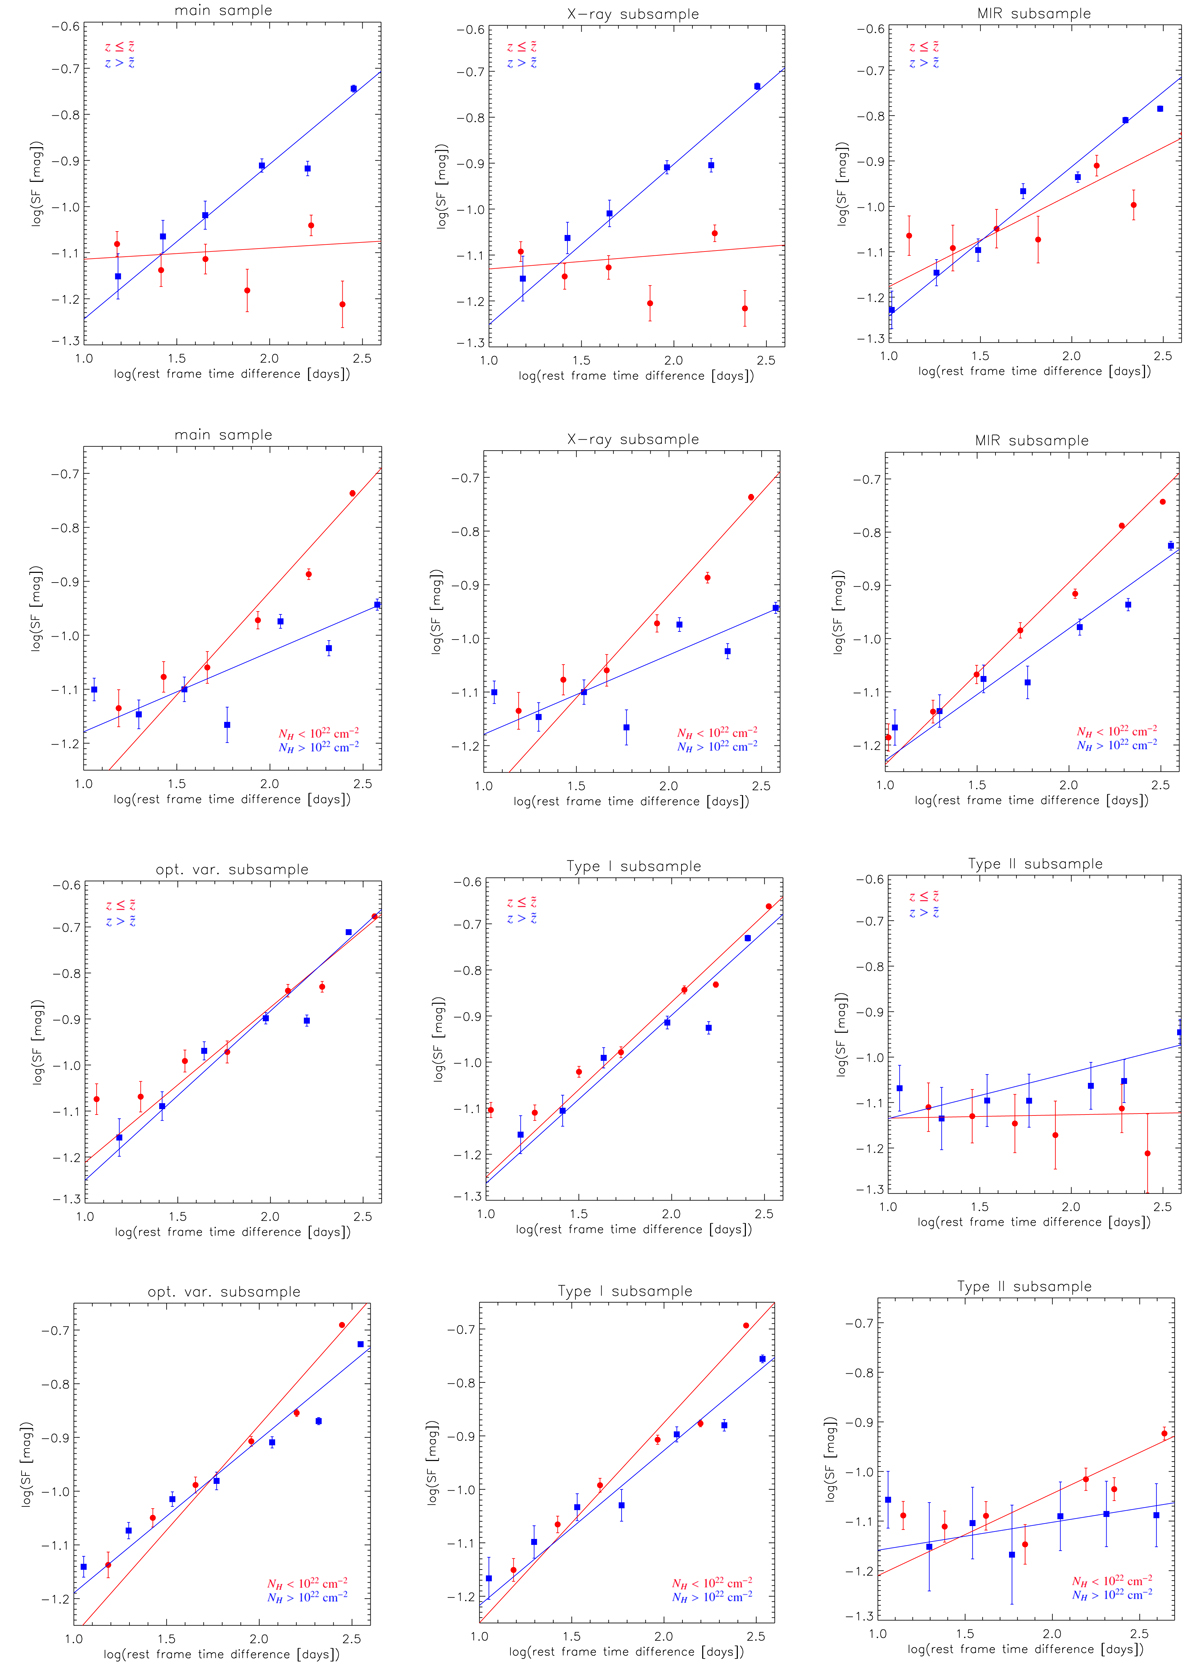
Analysis of the dependence of variability on redshift and absorption (quantified by the hydrogen column density NH), focusing on the linear regions of the SF for the six samples of AGN selected for this study: the two top lines show panels for the main sample (left), X-ray AGN (center), and MIR AGN (right); the two bottom lines show panels for optically variable AGN (left), Type I AGN (center), and Type II AGN (right). Redshift (odd lines) and absorption (even lines) panels are coupled for each sample of sources, in order to ease the comparison of the results. Red dots indicate the samples of sources with lower redshift or absorption, depending on what the panel at issue represents; blue squares indicate the sources with higher redshift or absorption values. As usual, the represented rest-frame baseline corresponds to ≈10−400 days.
Current usage metrics show cumulative count of Article Views (full-text article views including HTML views, PDF and ePub downloads, according to the available data) and Abstracts Views on Vision4Press platform.
Data correspond to usage on the plateform after 2015. The current usage metrics is available 48-96 hours after online publication and is updated daily on week days.
Initial download of the metrics may take a while.