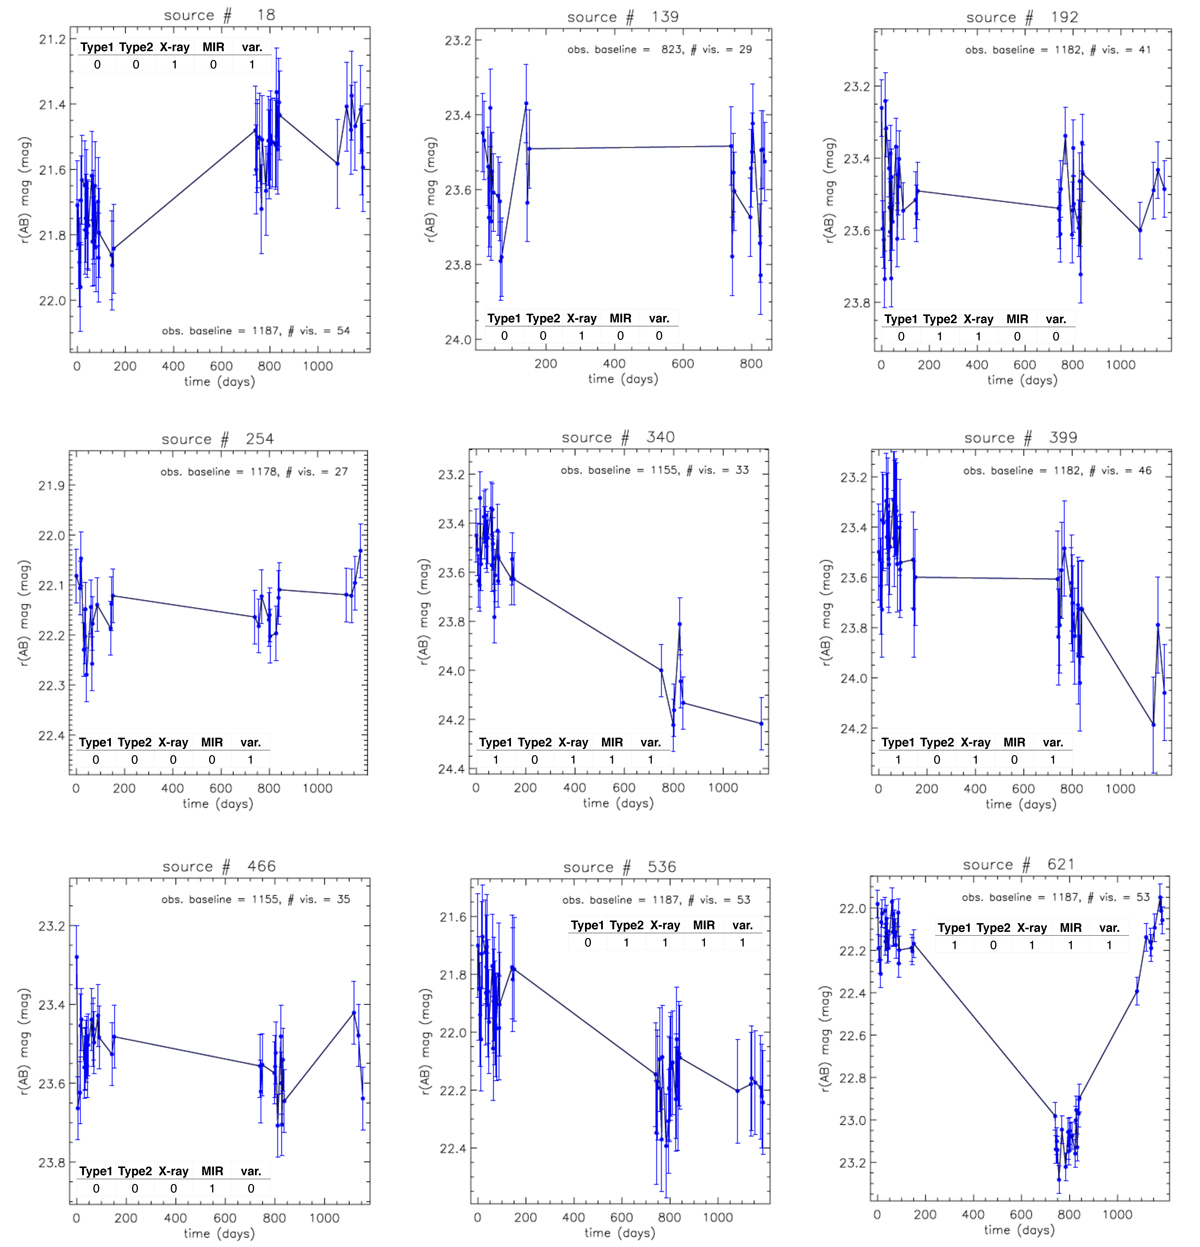
Fig. 1.
Download original image
Selection of light curves from the main sample (baselines are in days). The source numbered 18 is an example of the most commonly observed ones in this sample, where both the length of the observed baseline and the number of visits coincide with the corresponding maxima (see Table 1); source 139 is the one with the shortest baseline, while source 254 is one of the two detected in 27 visits (i.e., the minimum number of visits based on our selection threshold; see main text); the other instances correspond to other combinations of observed baseline and number of visits. We note that the light curve of source 621 is characterized by the largest magnitude variation over the analyzed baseline. The table in each panel indicates which subsample(s) the corresponding source belongs/does not belong to (1/0).
Current usage metrics show cumulative count of Article Views (full-text article views including HTML views, PDF and ePub downloads, according to the available data) and Abstracts Views on Vision4Press platform.
Data correspond to usage on the plateform after 2015. The current usage metrics is available 48-96 hours after online publication and is updated daily on week days.
Initial download of the metrics may take a while.