Fig. 9.
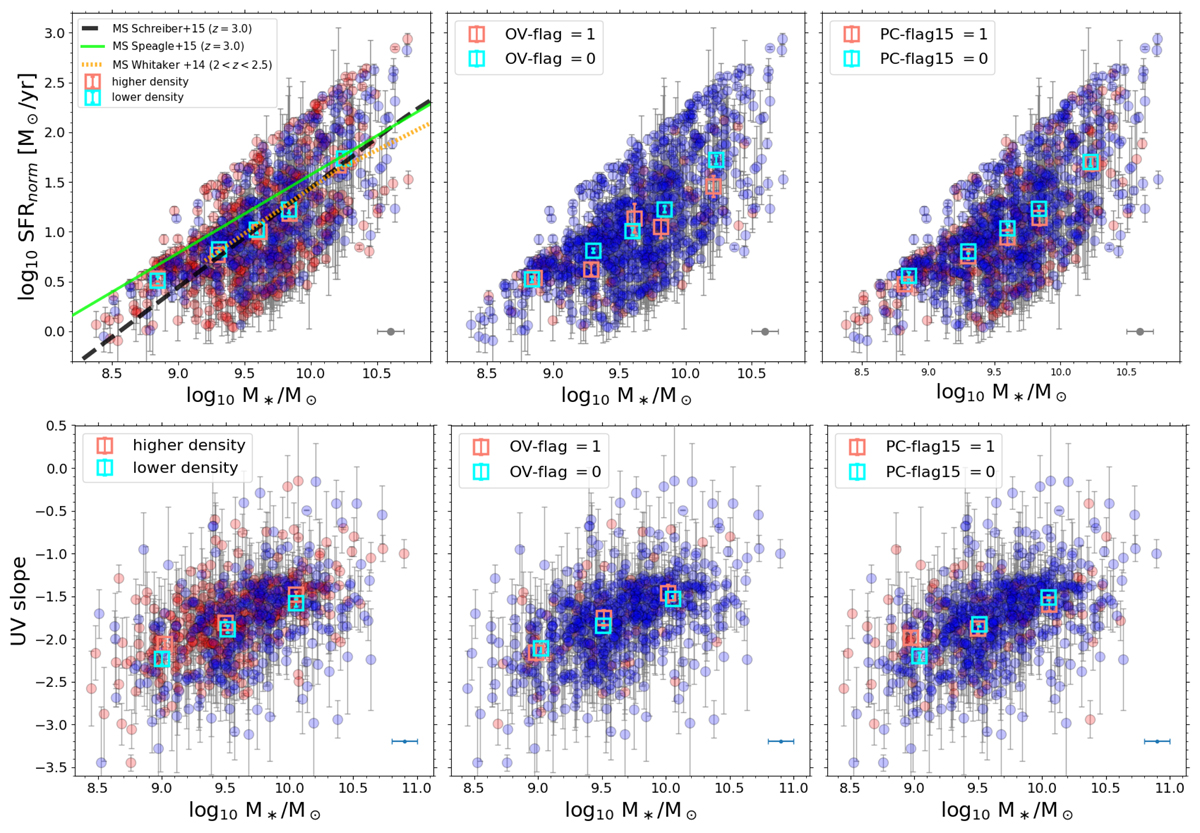
Download original image
Environmental dependence of the SFR–stellar mass and β–mass relations for the VANDELS galaxies analyzed in this work (first and second row, respectively). The colors of the symbols in each plot are based (from left to right) on the local density (higher or lower than the sample median), overdensity flag, and protocluster membership PC-flag (15 cMpc). The main sequence of star formation at redshift ∼3 from different works is also shown for comparison in the first plot. The SFR has been normalized to z = 3 following the ∼(1 + z)2.8 redshift dependence of Sargent et al. (2014). The typical uncertainties on the stellar masses from SED fitting are shown in the bottom right corner of each plot.
Current usage metrics show cumulative count of Article Views (full-text article views including HTML views, PDF and ePub downloads, according to the available data) and Abstracts Views on Vision4Press platform.
Data correspond to usage on the plateform after 2015. The current usage metrics is available 48-96 hours after online publication and is updated daily on week days.
Initial download of the metrics may take a while.