Fig. 4.
Download original image
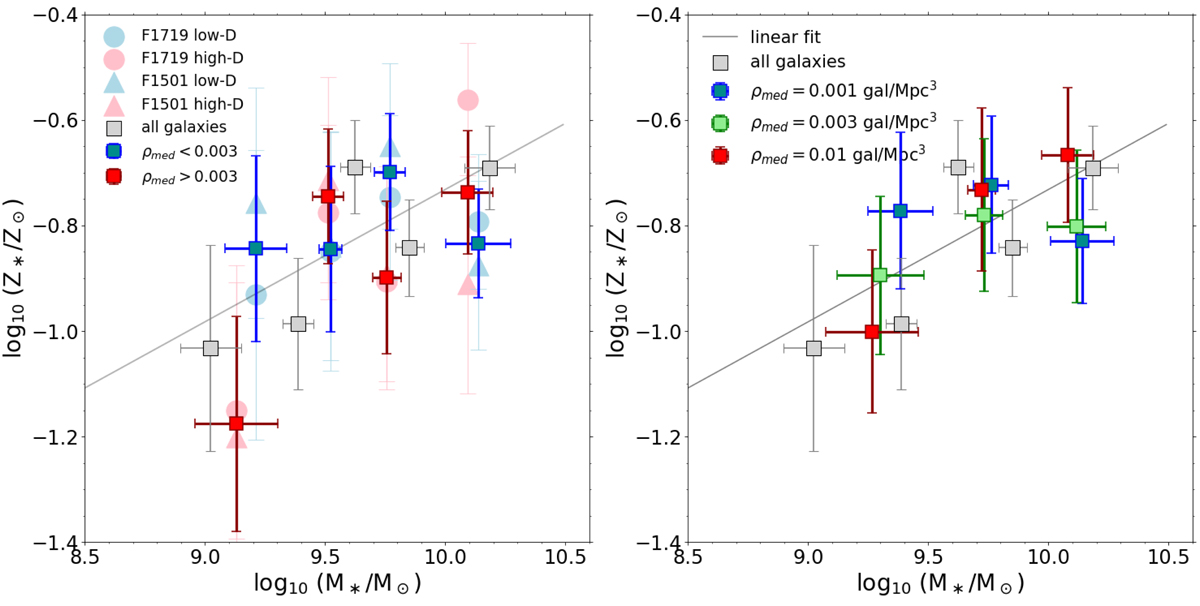
Figure showing the MZR in different bins of local galaxy density. Left panel: stellar MZR of the whole population of star-forming galaxies at 2 < z < 4 (gray squares) with its best-fit relation (gray continuous line). Overplotted are the MZR, color-coded according to the local galaxy density lower (blue squares) or higher (red squares) than the sample median of 0.003 gal Mpc−3, with the linear relations fitted to each subset (fixing the slope to the global MZR value), and drawn with the corresponding colors. The shaded area around the best-fit relations represent the 1σ uncertainty for the MZR normalization. The large squares represent the median stellar mass of the galaxies in each bin and the stellar metallicity derived from their spectral stack (see text). The large shaded triangles and circles indicate instead the metallicities obtained from each of the two features (at 1501 and 1719 Å, respectively) that contribute to the average metallicity value in the bin. The horizontal and vertical error bars of the large squares respectively represent the standard deviation of M⋆ in each bin and the 1σ uncertainty associated with the metallicity measurement. Right panel: same as above, but using three bins of local density, with the intermediate density bin drawn in green. The legend gives the median local density for each of the three subsets.
Current usage metrics show cumulative count of Article Views (full-text article views including HTML views, PDF and ePub downloads, according to the available data) and Abstracts Views on Vision4Press platform.
Data correspond to usage on the plateform after 2015. The current usage metrics is available 48-96 hours after online publication and is updated daily on week days.
Initial download of the metrics may take a while.