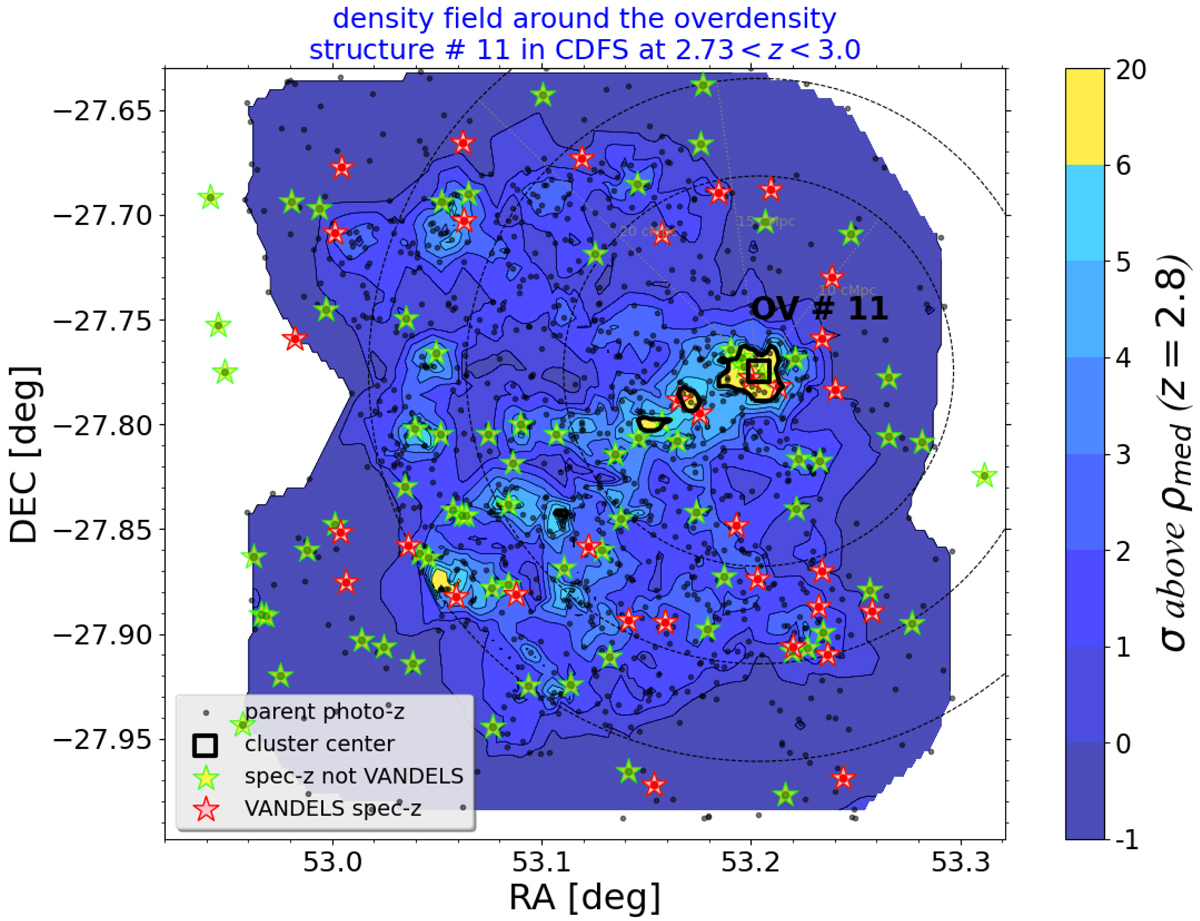
Fig. 2.
Download original image
Example of an overdensity structure identified at z ≃ 2.8 in the CDFS field. The contours of the local galaxy density (gal Mpc−3) estimated with the method of Guaita et al. (2020) are overplotted; the different levels correspond to the enhancement in units of 1σ compared to the average galaxy density and standard deviation in the given redshift range. The symbols represent the galaxy sample used for the determination of the density map in Sect. 2.2. In particular, the black points, red stars, and green stars identify, respectively, galaxies with photometric redshifts, the VANDELS sample with spectroscopic redshift flag ≥ 2, and galaxies with spectroscopic redshift coming from surveys other than VANDELS. The big empty black square and the continuous black line represent, respectively, the center of the overdensity structure and its boundaries in projected space. The black dashed circles with increasing radii of 10, 15, and 20 cMpc from the overdensity structure centers are used for an alternative definition of protoclusters, assuming a Δz = 0.04 along the redshift direction. Only VANDELS galaxies with z-flag ≥ 3 were used for the stacking and metallicity estimations in Sect. 2.4.
Current usage metrics show cumulative count of Article Views (full-text article views including HTML views, PDF and ePub downloads, according to the available data) and Abstracts Views on Vision4Press platform.
Data correspond to usage on the plateform after 2015. The current usage metrics is available 48-96 hours after online publication and is updated daily on week days.
Initial download of the metrics may take a while.