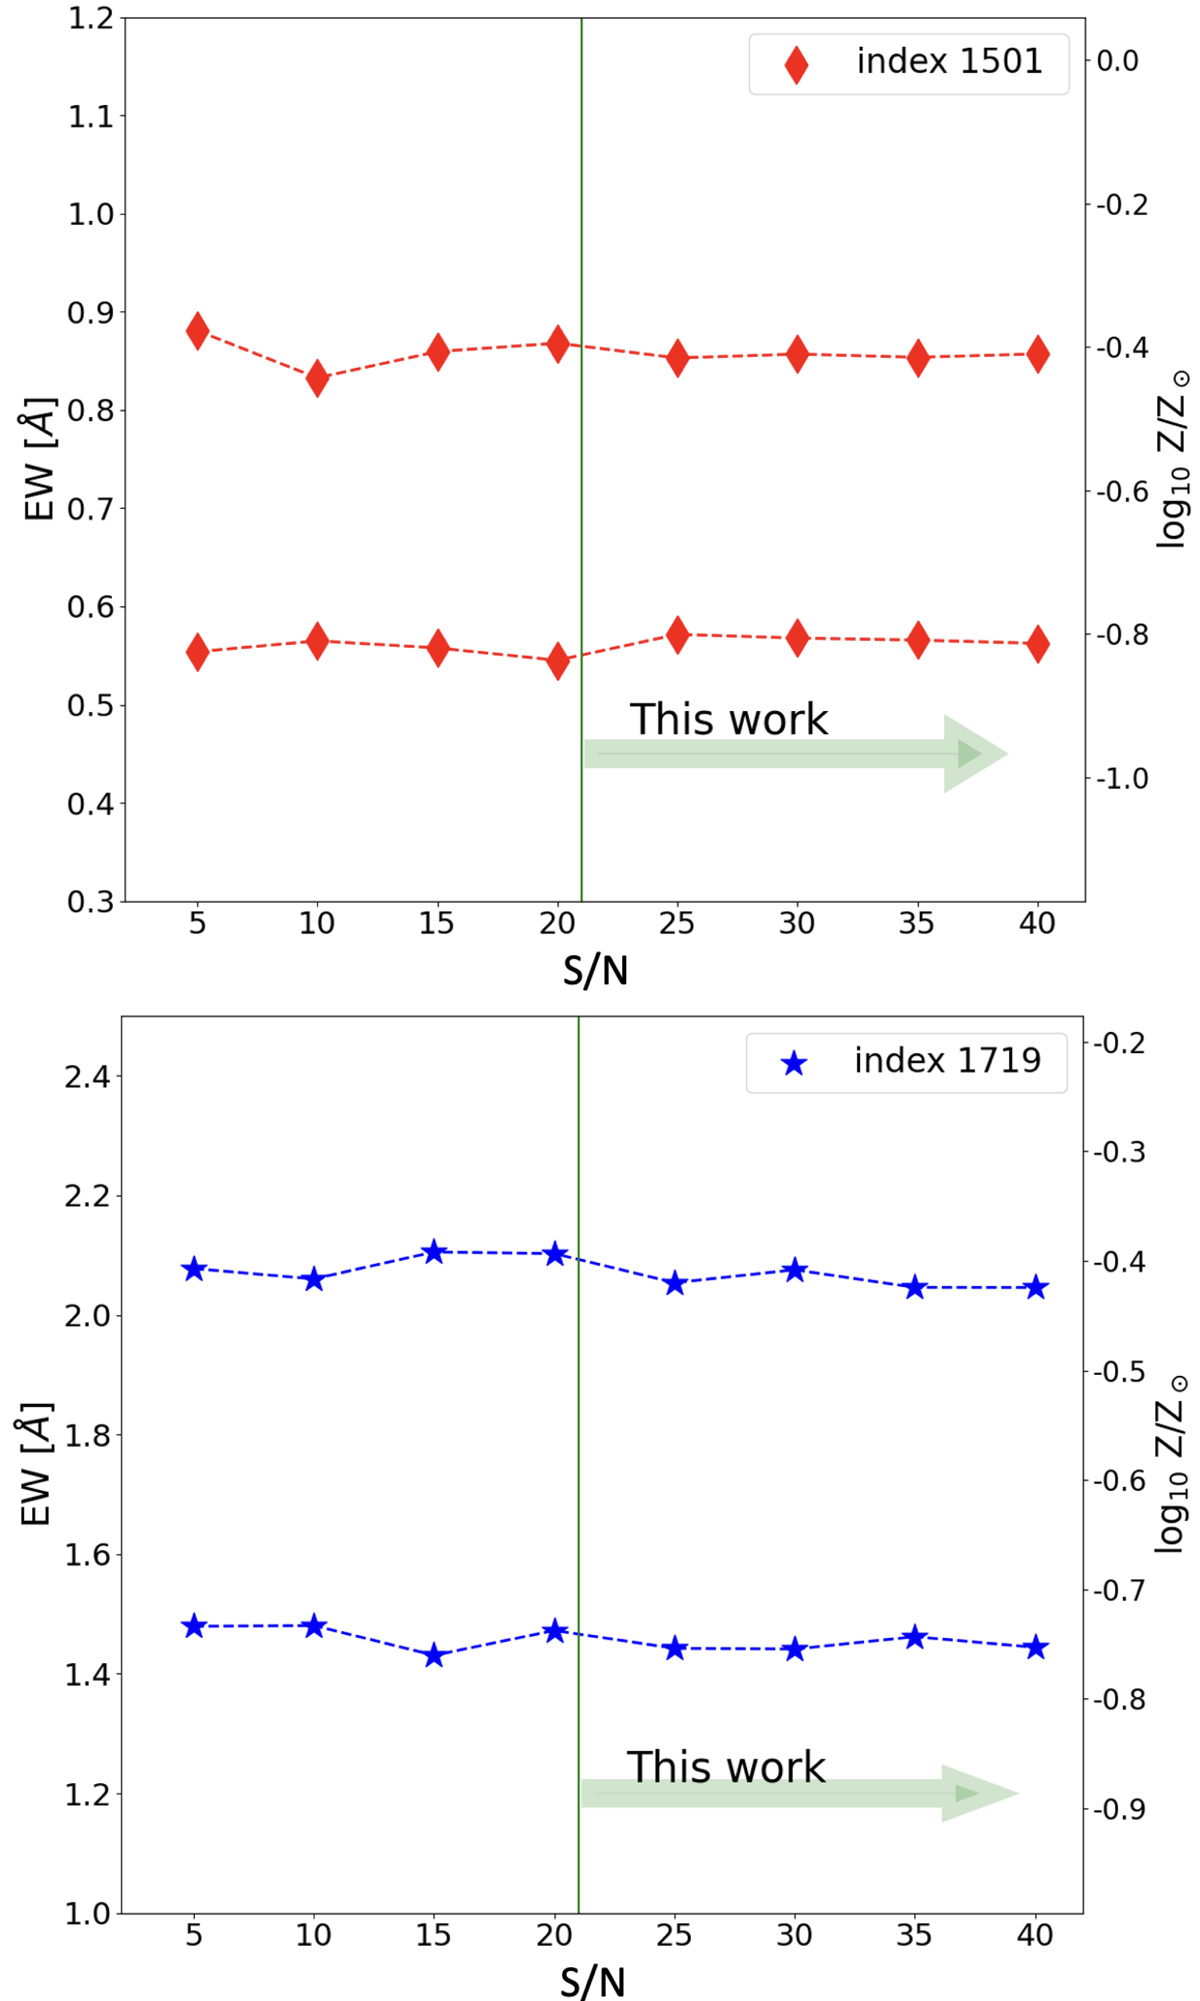
Fig. A.1.
Download original image
Figure showing the results of simulations that we made to test the influence of the S/N on the measured EW for the two absorption features used in this work as metallicity indicators. Top: Relation between the measured EW (and recovered stellar metallicity on the left y-axis, using the calibrations in Equations 1) and input spectrum S/N for the 1501 Å index. This is obtained through Monte Carlo simulations where Gaussian noise is added to Starburst99 templates with two different metallicities Z⋆ = 0.2 and 0.4 × Z⊙. The vertical green line highlights the S/N range of the stacks that we analyze in our work. Bottom: Same as the upper panel, but for the 1719 Å index.
Current usage metrics show cumulative count of Article Views (full-text article views including HTML views, PDF and ePub downloads, according to the available data) and Abstracts Views on Vision4Press platform.
Data correspond to usage on the plateform after 2015. The current usage metrics is available 48-96 hours after online publication and is updated daily on week days.
Initial download of the metrics may take a while.