Fig. 9
Download original image
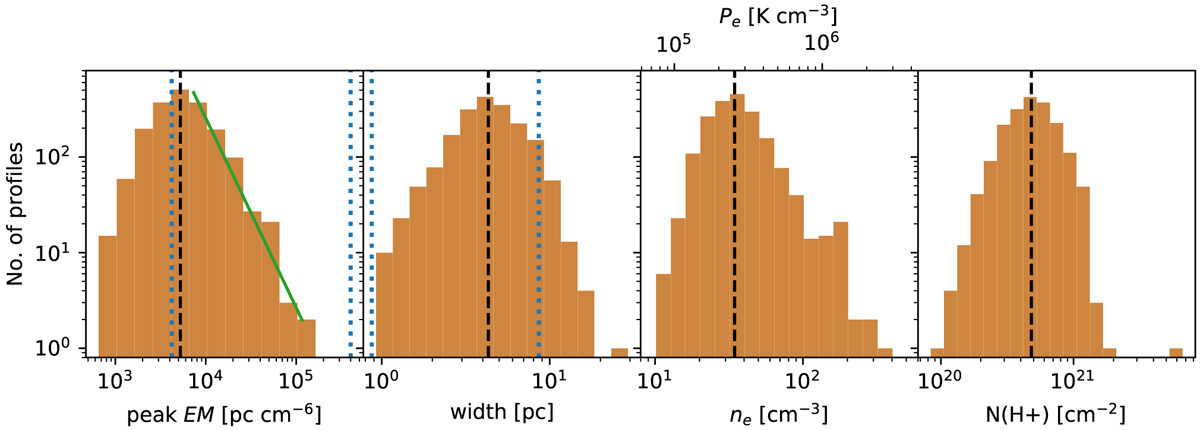
Histograms of the properties of filamentary structure inferred from Gaussian fits to their EM radial profiles. Dashed black lines mark the median values. Dotted blue lines mark the estimated completeness limits in the EM and width plots. Left: peak EM of the best fit in units of pc cm−6. The median EM of the filamentary structure identified in this analysis is 5200 pc cm−6. The solid green line shows the power law, β = −2.0 ± 0.2, fit to the distribution for EM > 5200 pc cm−6. Center left: filament profile FWHM in units of pc. The median FWHM of the filamentary structure identified in this analysis is 4.3 pc. The resolution of the beam FWHM (2′ ~ 0.9 pc) is marked (with a dotted red line) as the lower completeness limit. Widths smaller than the beam resolution result from poor fits. Center right: average electron density of the filament profiles in units of cm−3, computed with the best-fit peak EM and width as ![]() , where ℓ is the FWHM of the Gaussian profile. The median electron density of the filamentary structure identified in this analysis is 35 cm−3. The electron pressure, computed as Pe/kB ~ 7400 K ne, is shown along the top axis. Right: column density of ionized hydrogen, letting ne ~ nH+.
, where ℓ is the FWHM of the Gaussian profile. The median electron density of the filamentary structure identified in this analysis is 35 cm−3. The electron pressure, computed as Pe/kB ~ 7400 K ne, is shown along the top axis. Right: column density of ionized hydrogen, letting ne ~ nH+.
Current usage metrics show cumulative count of Article Views (full-text article views including HTML views, PDF and ePub downloads, according to the available data) and Abstracts Views on Vision4Press platform.
Data correspond to usage on the plateform after 2015. The current usage metrics is available 48-96 hours after online publication and is updated daily on week days.
Initial download of the metrics may take a while.