Fig. 8
Download original image
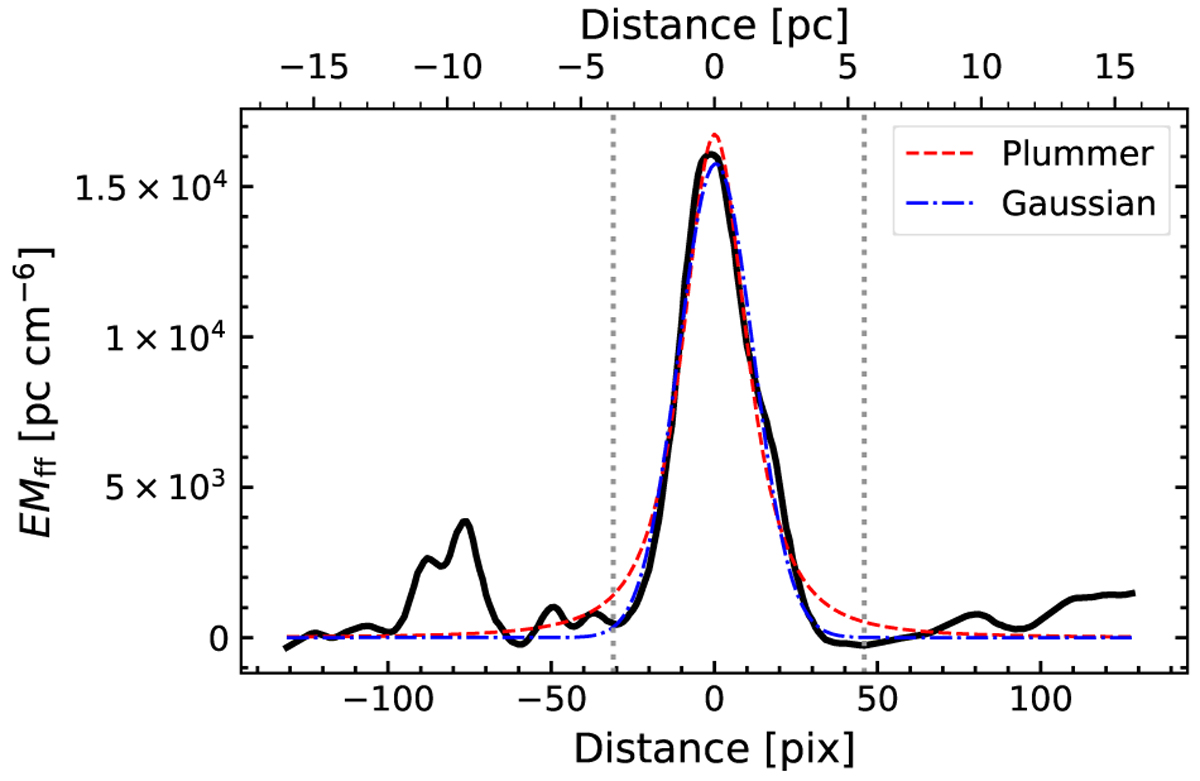
EM radial profile of a filament segment, shown with a solid black line. The radial profile has been baseline- and background-subtracted. Negative distances from the spine point toward the northeast and positive distances toward the southwest with respect to the filament. The dot-dashed blue line shows the best-fit Gaussian used to compute the filament profile properties. For comparison, the dashed red line shows the best-fit Plummer profile with a power-law index of p = 4.
Current usage metrics show cumulative count of Article Views (full-text article views including HTML views, PDF and ePub downloads, according to the available data) and Abstracts Views on Vision4Press platform.
Data correspond to usage on the plateform after 2015. The current usage metrics is available 48-96 hours after online publication and is updated daily on week days.
Initial download of the metrics may take a while.