Fig. 7
Download original image
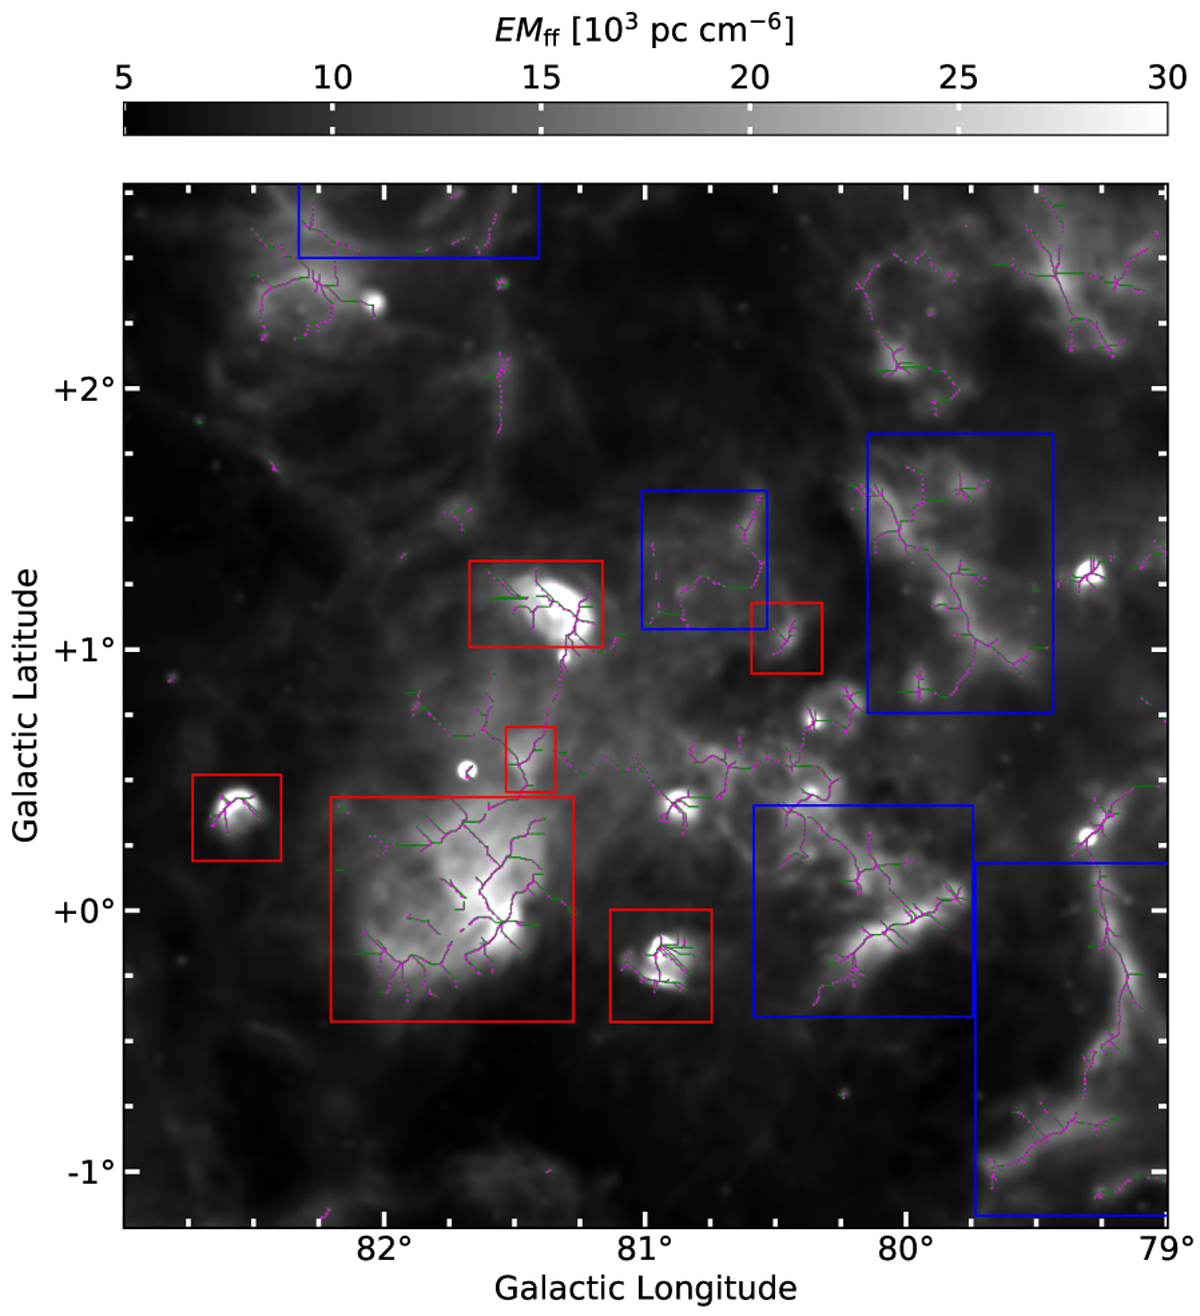
Filaments identified with DisPerSE (in green). Purple data points mark the locations along the filament of the average radial profiles that contributed to the analysis. The gray-scale image is the EM, computed from the 1.4 GHz continuum intensity assuming optically thin thermal emission, and is the image on which the filaments are identified. Red (blue) boxes encompass select filaments identified with (without) a known massive star that locally contributes to ionization.
Current usage metrics show cumulative count of Article Views (full-text article views including HTML views, PDF and ePub downloads, according to the available data) and Abstracts Views on Vision4Press platform.
Data correspond to usage on the plateform after 2015. The current usage metrics is available 48-96 hours after online publication and is updated daily on week days.
Initial download of the metrics may take a while.