Fig. 12
Download original image
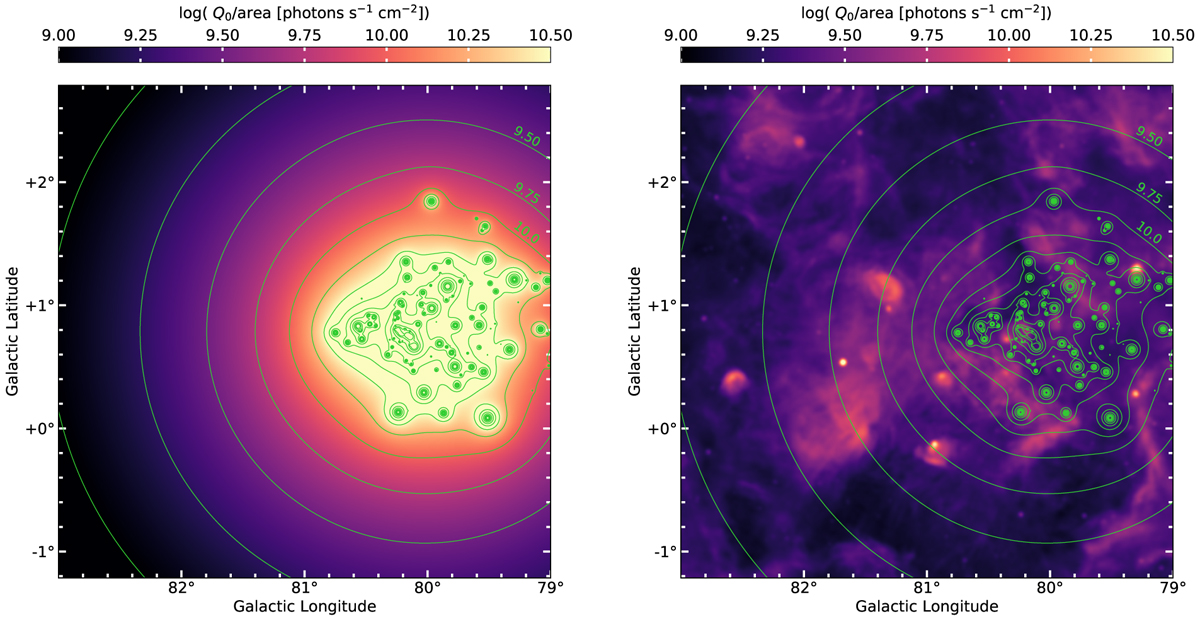
The ionizing photon rate per unit area of Cyg OB2. Left: map of the ionizing photon (>13.6 eV) rate per unit area constructed from the observed OB stars of the Cyg OB2 association (for details, see Appendix B). Green contours are shown at log(Q0/area [photons s−1 cm−2]) = (9,9.25,9.5, …12.25). Right: ionizing photon rate per unit area as traced by thermal free-free emission. The green contours of the Cyg OB2 ionizing field are overlaid.
Current usage metrics show cumulative count of Article Views (full-text article views including HTML views, PDF and ePub downloads, according to the available data) and Abstracts Views on Vision4Press platform.
Data correspond to usage on the plateform after 2015. The current usage metrics is available 48-96 hours after online publication and is updated daily on week days.
Initial download of the metrics may take a while.