Open Access
Fig. 11
Download original image
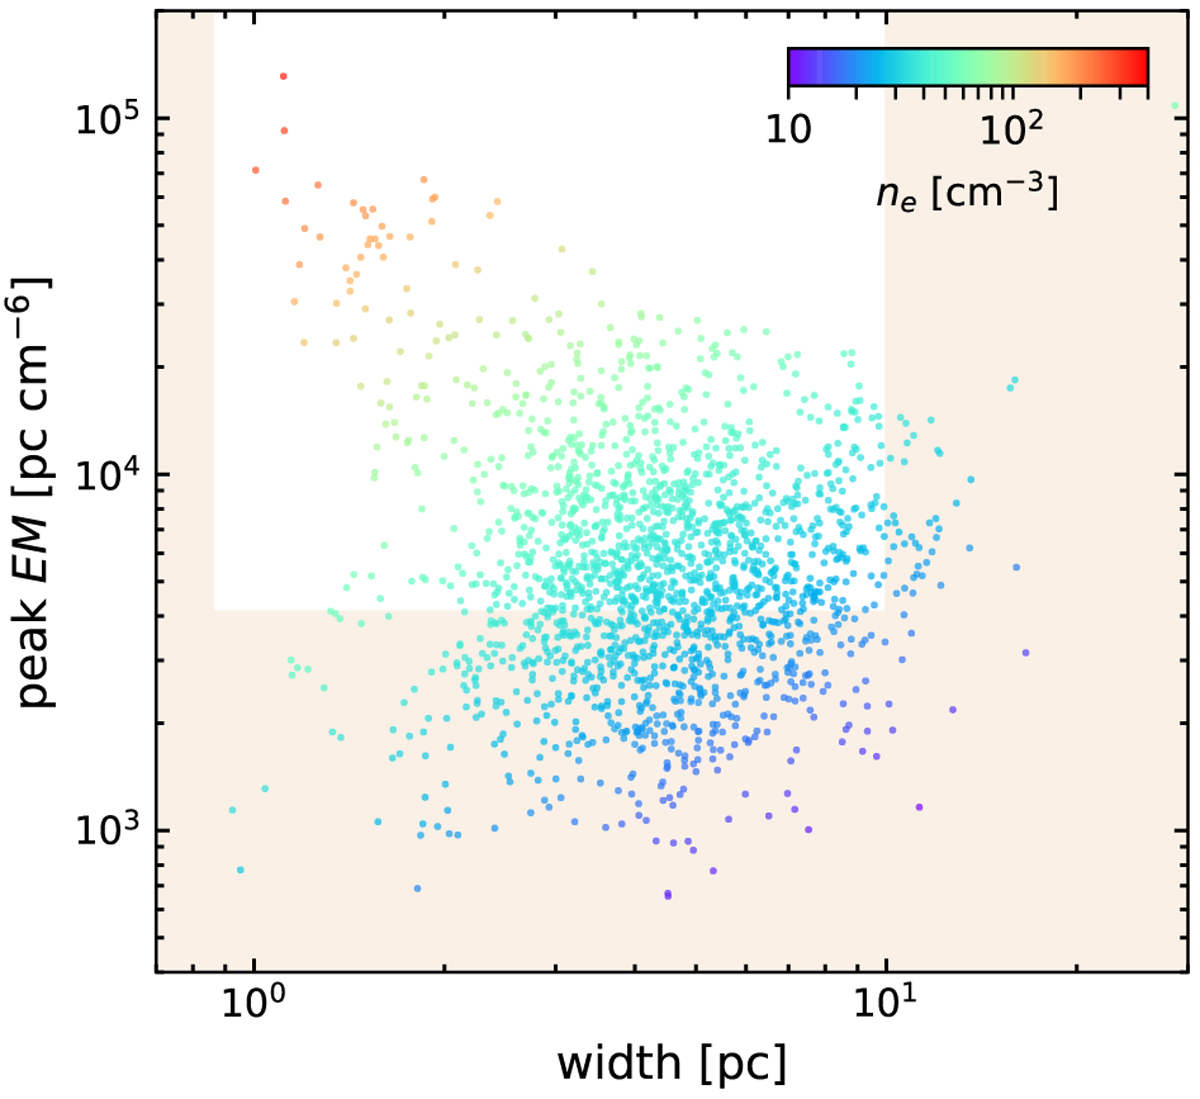
Peak EM of the best fit to the filament radial profile plotted with the best-fit FWHM. The shaded tan areas represent values that fall outside of our completeness limits. The colors of the data points represent the electron density inferred from the filament profile EM and width.
Current usage metrics show cumulative count of Article Views (full-text article views including HTML views, PDF and ePub downloads, according to the available data) and Abstracts Views on Vision4Press platform.
Data correspond to usage on the plateform after 2015. The current usage metrics is available 48-96 hours after online publication and is updated daily on week days.
Initial download of the metrics may take a while.