Fig. 10
Download original image
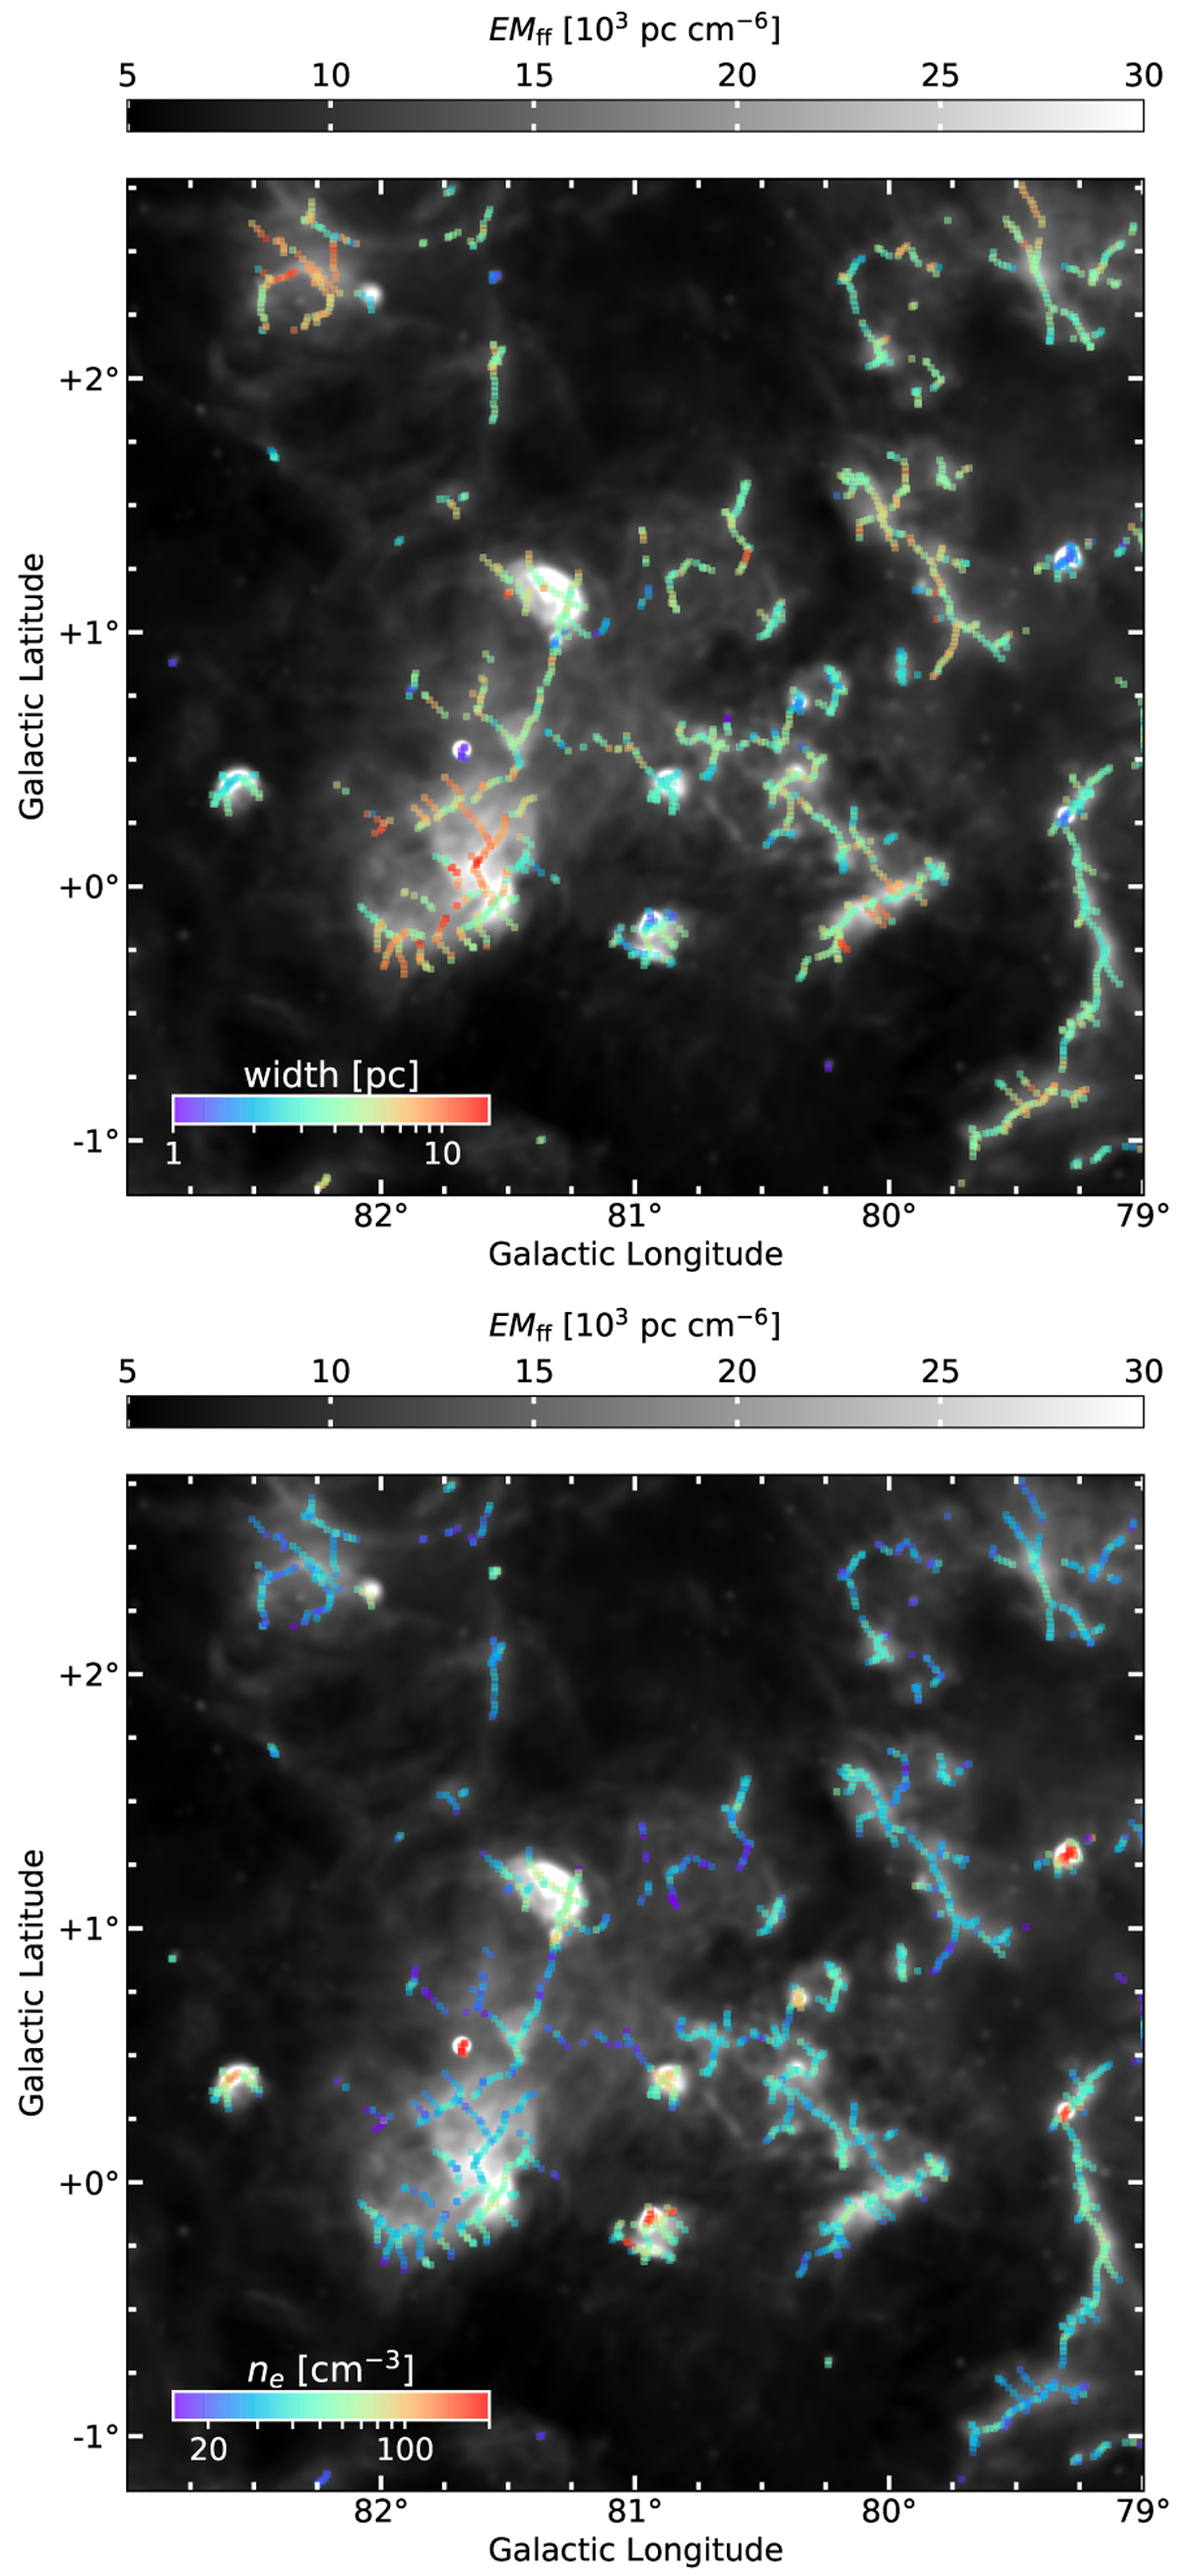
Spatial rendering of the derived properties of filamentary structure. Top: width of filaments’ mean radial profiles represented as colored data points and overplotted on the EM map. Compact bright regions tend to have smaller widths. Another notable region is DR 23, which has wider filamentary structure than average. Bottom: estimated density of each radial profile represented as colored data points and overplotted on the EM map. As expected, densities are highest in known star-forming regions.
Current usage metrics show cumulative count of Article Views (full-text article views including HTML views, PDF and ePub downloads, according to the available data) and Abstracts Views on Vision4Press platform.
Data correspond to usage on the plateform after 2015. The current usage metrics is available 48-96 hours after online publication and is updated daily on week days.
Initial download of the metrics may take a while.