Fig. 1
Download original image
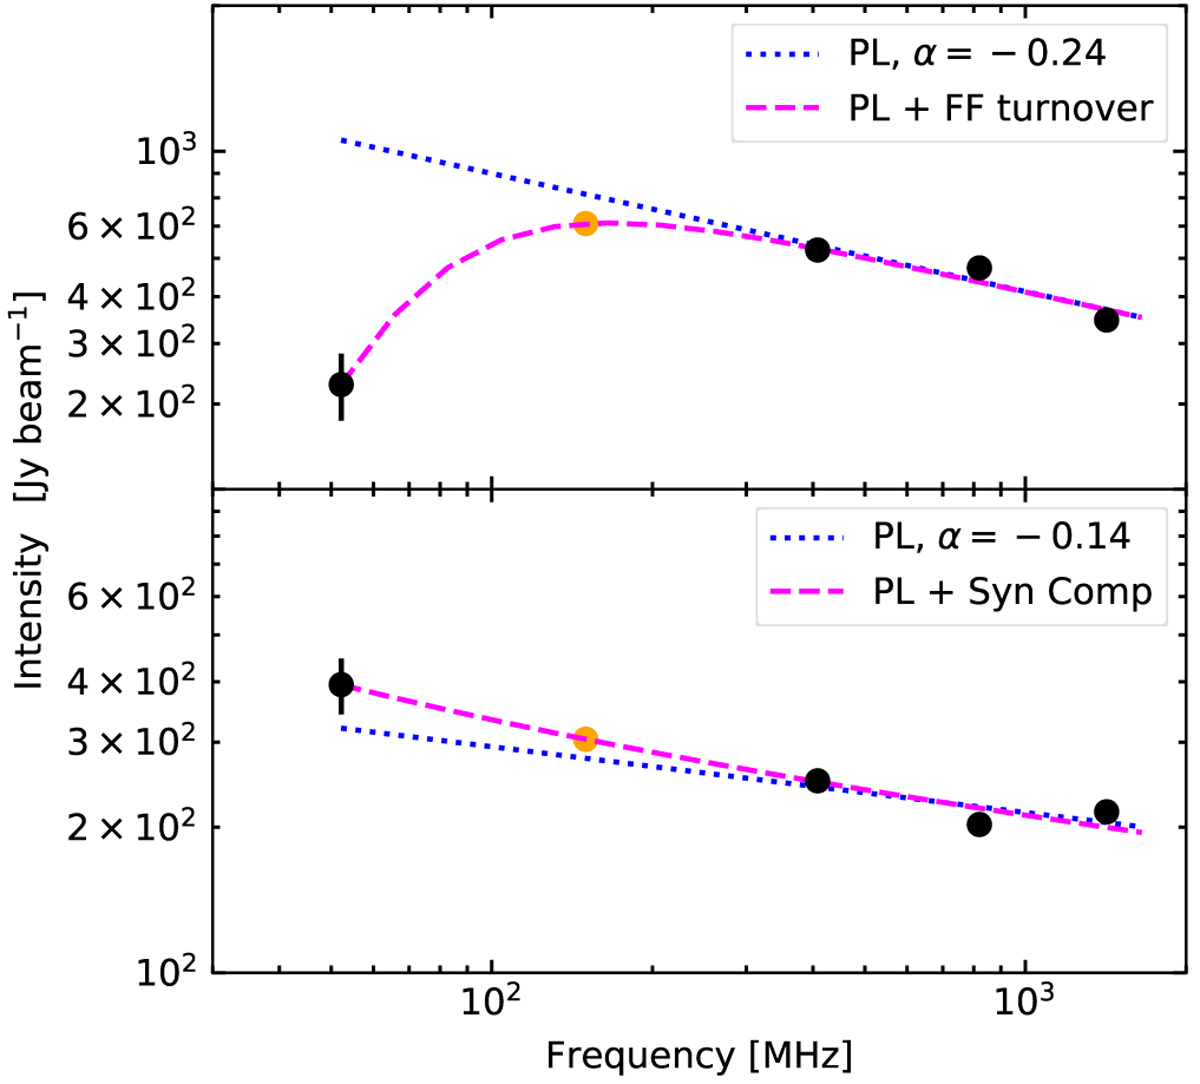
Examples of the multifrequency fits (done on a pixel-by-pixel basis) to frequency-interpolate the “short-spacing” map – a low-resolution image with sensitivity to large angular scales – at 148 MHz. The black data points represent the survey data used in the fit. The orange data point represents the interpolated value at 148 MHz. The dotted blue line represents the power-law fit to the high-frequency data points at 408, 820, and 1420 MHz. The dashed magenta line represents the final SED fit – where either a free-free turnover (top) is fit (Eq. (1)) or a synchrotron component (bottom) is added (Eq. (2)) to match the low-frequency point at 52 MHz.
Current usage metrics show cumulative count of Article Views (full-text article views including HTML views, PDF and ePub downloads, according to the available data) and Abstracts Views on Vision4Press platform.
Data correspond to usage on the plateform after 2015. The current usage metrics is available 48-96 hours after online publication and is updated daily on week days.
Initial download of the metrics may take a while.