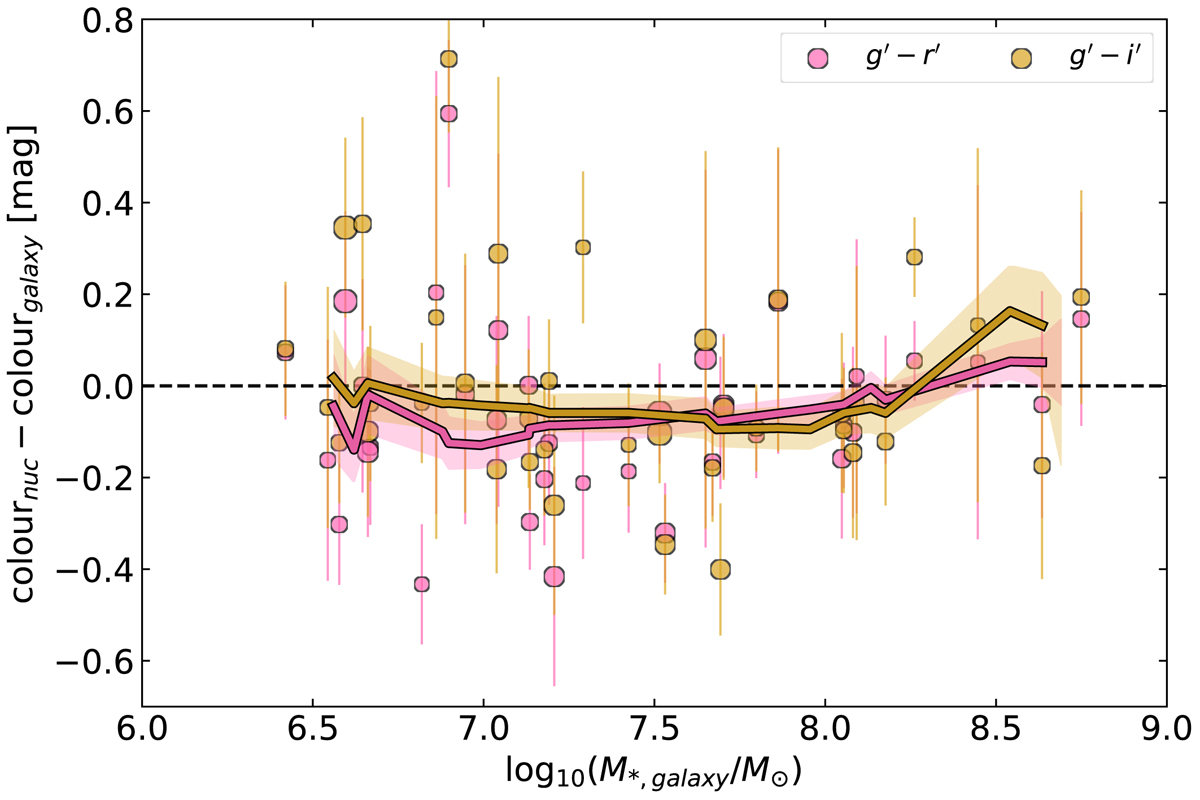
Fig. 9.
Download original image
Difference in colour between nucleus and its host galaxy as a function of the host galaxy stellar mass. We show both g′−r′ (pink) and g′−i′ (gold) colours based on the multi-component decomposition models. The moving averages were calculated using a bin width of 2 dex and moved in steps of 0.2 dex. The shaded regions denote the SEM. The marker size denotes the nucleus contrast. The uncertainties were estimated by propagating the nuclei colour uncertainties (see Appendix D) and the galaxy colour uncertainties calculated in Su et al. (2021; see their Table 1).
Current usage metrics show cumulative count of Article Views (full-text article views including HTML views, PDF and ePub downloads, according to the available data) and Abstracts Views on Vision4Press platform.
Data correspond to usage on the plateform after 2015. The current usage metrics is available 48-96 hours after online publication and is updated daily on week days.
Initial download of the metrics may take a while.