Open Access
Fig. 8.
Download original image
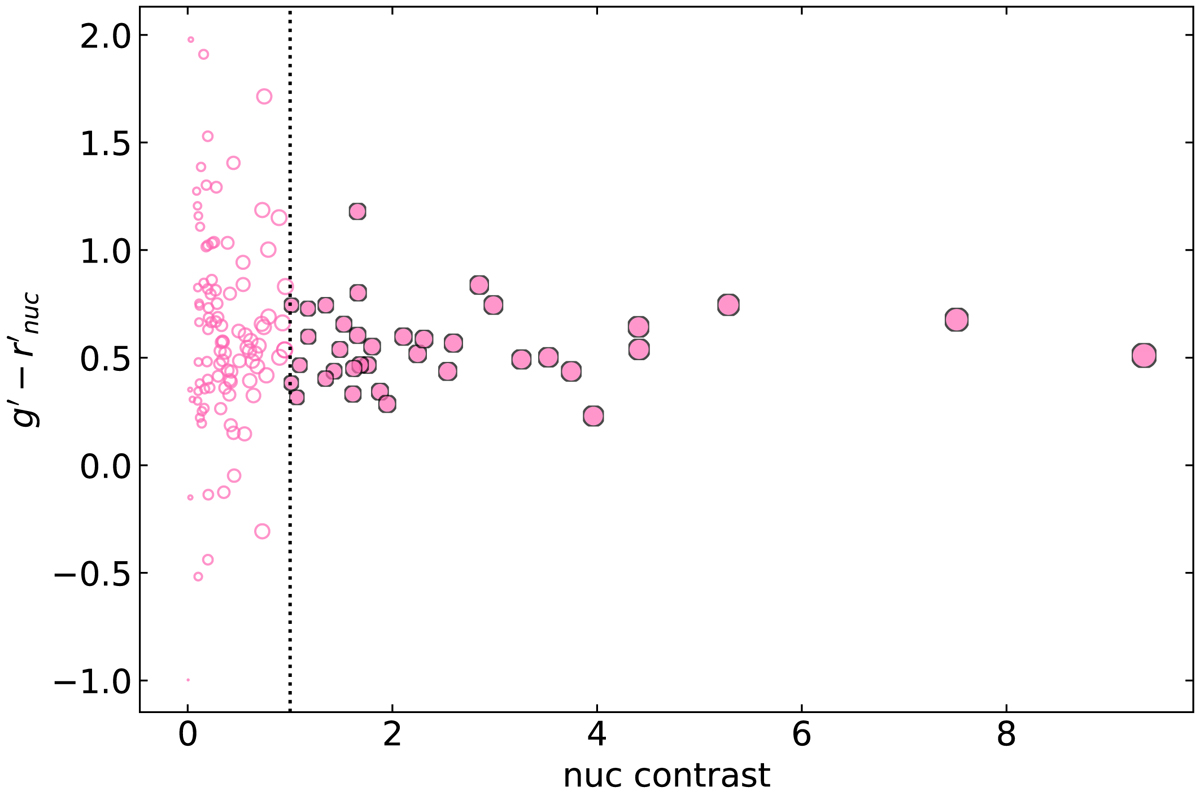
Nucleus g′−r′ colour as a function of nucleus contrast (see Eq. (B.1)) for nuclei of early-type galaxies. The marker size denotes the nucleus contrast. The dotted vertical line denotes the limit of nucleus contrast = 1, which loosely separates nuclei with high and low scatter in colour.
Current usage metrics show cumulative count of Article Views (full-text article views including HTML views, PDF and ePub downloads, according to the available data) and Abstracts Views on Vision4Press platform.
Data correspond to usage on the plateform after 2015. The current usage metrics is available 48-96 hours after online publication and is updated daily on week days.
Initial download of the metrics may take a while.