Fig. 7.
Download original image
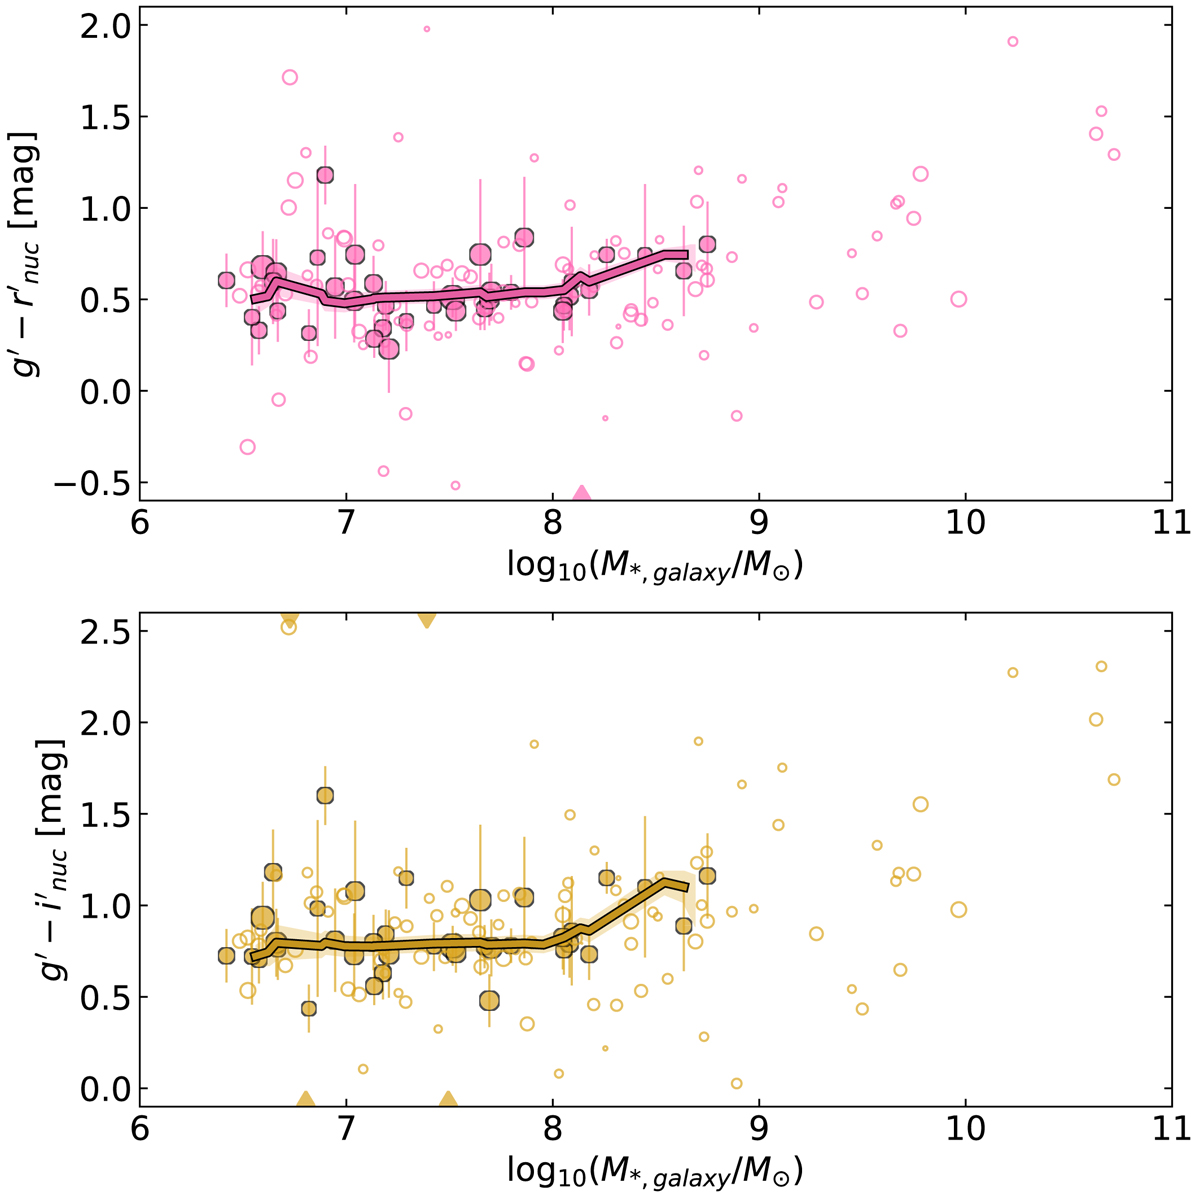
g′−r′ (upper) and g′−i′ (lower) as a function of host galaxy stellar mass. Filled circles are galaxies with nucleus contrast > 1, whereas open circles denote those with nucleus contrast < 1. The marker size denotes the nucleus contrast (see Eq. (B.1)), with bigger points denoting higher nucleus contrast. The solid lines denote the moving (median) averages of the solid points, which were calculated using a bin width of 2 dex, and moved in steps of 0.2 dex. The shaded regions denote the corresponding standard error of the mean (SEM) in the moving averages. Nuclei with values beyond the axis limits are denoted as triangles along the x-axes. The individual error bars were estimated in Appendix D.
Current usage metrics show cumulative count of Article Views (full-text article views including HTML views, PDF and ePub downloads, according to the available data) and Abstracts Views on Vision4Press platform.
Data correspond to usage on the plateform after 2015. The current usage metrics is available 48-96 hours after online publication and is updated daily on week days.
Initial download of the metrics may take a while.