Fig. 6.
Download original image
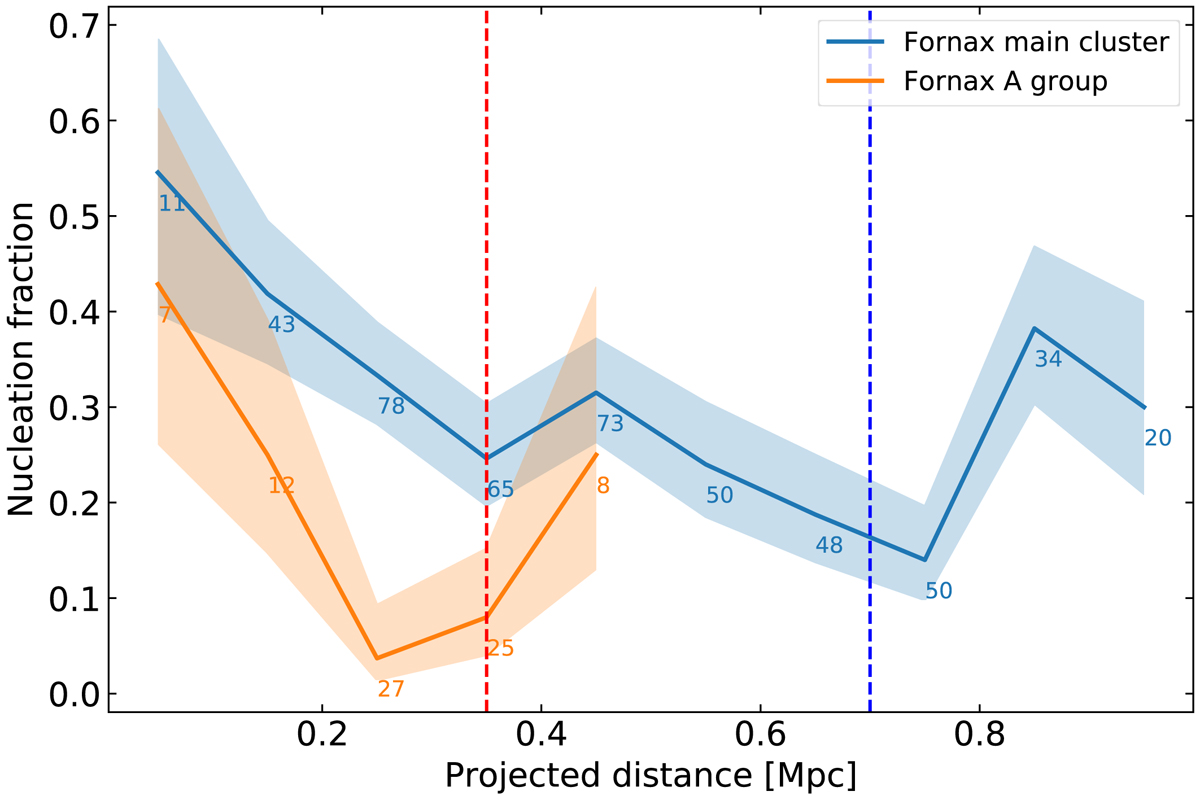
Nucleation fraction between the Fornax main cluster (blue) and the Fornax A group (orange) as a function of projected distance (using NGC1399 and NGC1316 as the centre for the Fornax main cluster and Fornax A group, respectively). The shaded regions denote the 68% binomial confidence interval. The number of galaxies in each bin are annotated in the plot. The dashed vertical lines denote the same limits as in Fig. 1.
Current usage metrics show cumulative count of Article Views (full-text article views including HTML views, PDF and ePub downloads, according to the available data) and Abstracts Views on Vision4Press platform.
Data correspond to usage on the plateform after 2015. The current usage metrics is available 48-96 hours after online publication and is updated daily on week days.
Initial download of the metrics may take a while.