Open Access
Fig. D.1.
Download original image
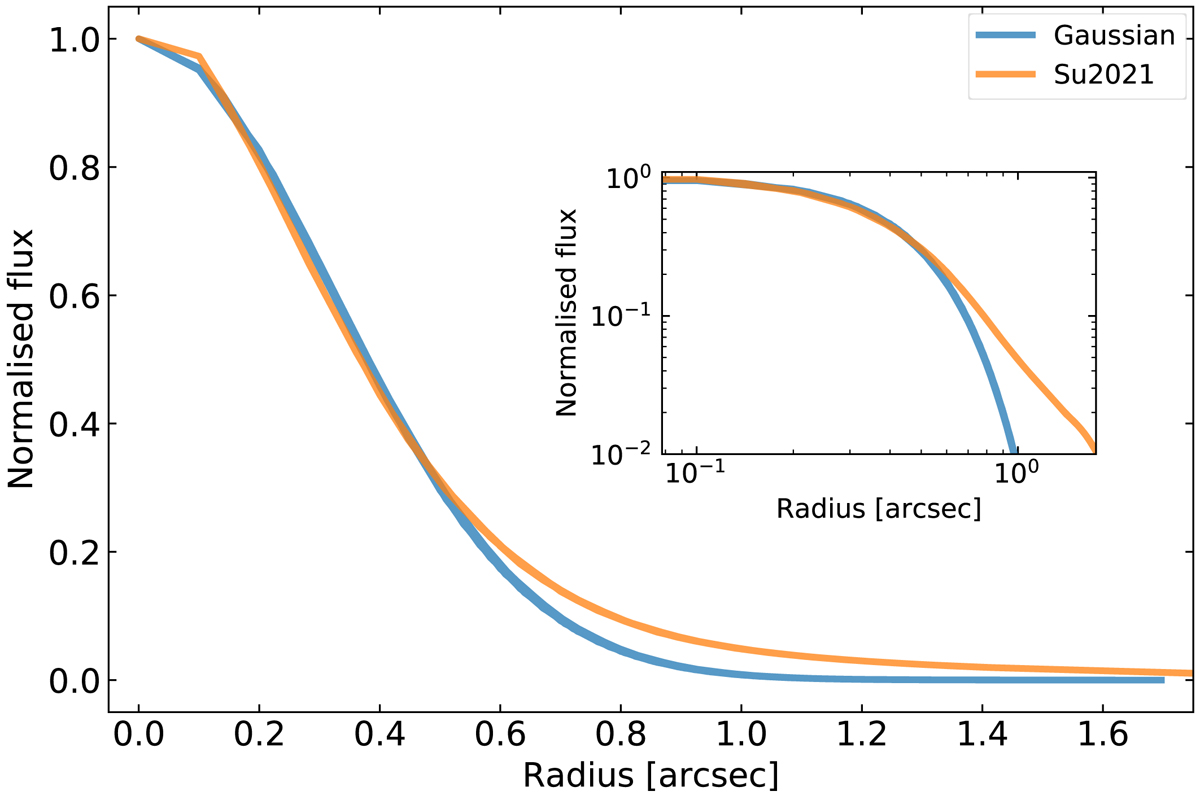
Comparison of PSF profiles from FDS25 field (orange; from Su et al. 2021) and the Gaussian fits from the postage stamp image of FDS25_0000 (blue) in the r′ band. The small inset plot shows the profiles in logarithmic axes.
Current usage metrics show cumulative count of Article Views (full-text article views including HTML views, PDF and ePub downloads, according to the available data) and Abstracts Views on Vision4Press platform.
Data correspond to usage on the plateform after 2015. The current usage metrics is available 48-96 hours after online publication and is updated daily on week days.
Initial download of the metrics may take a while.