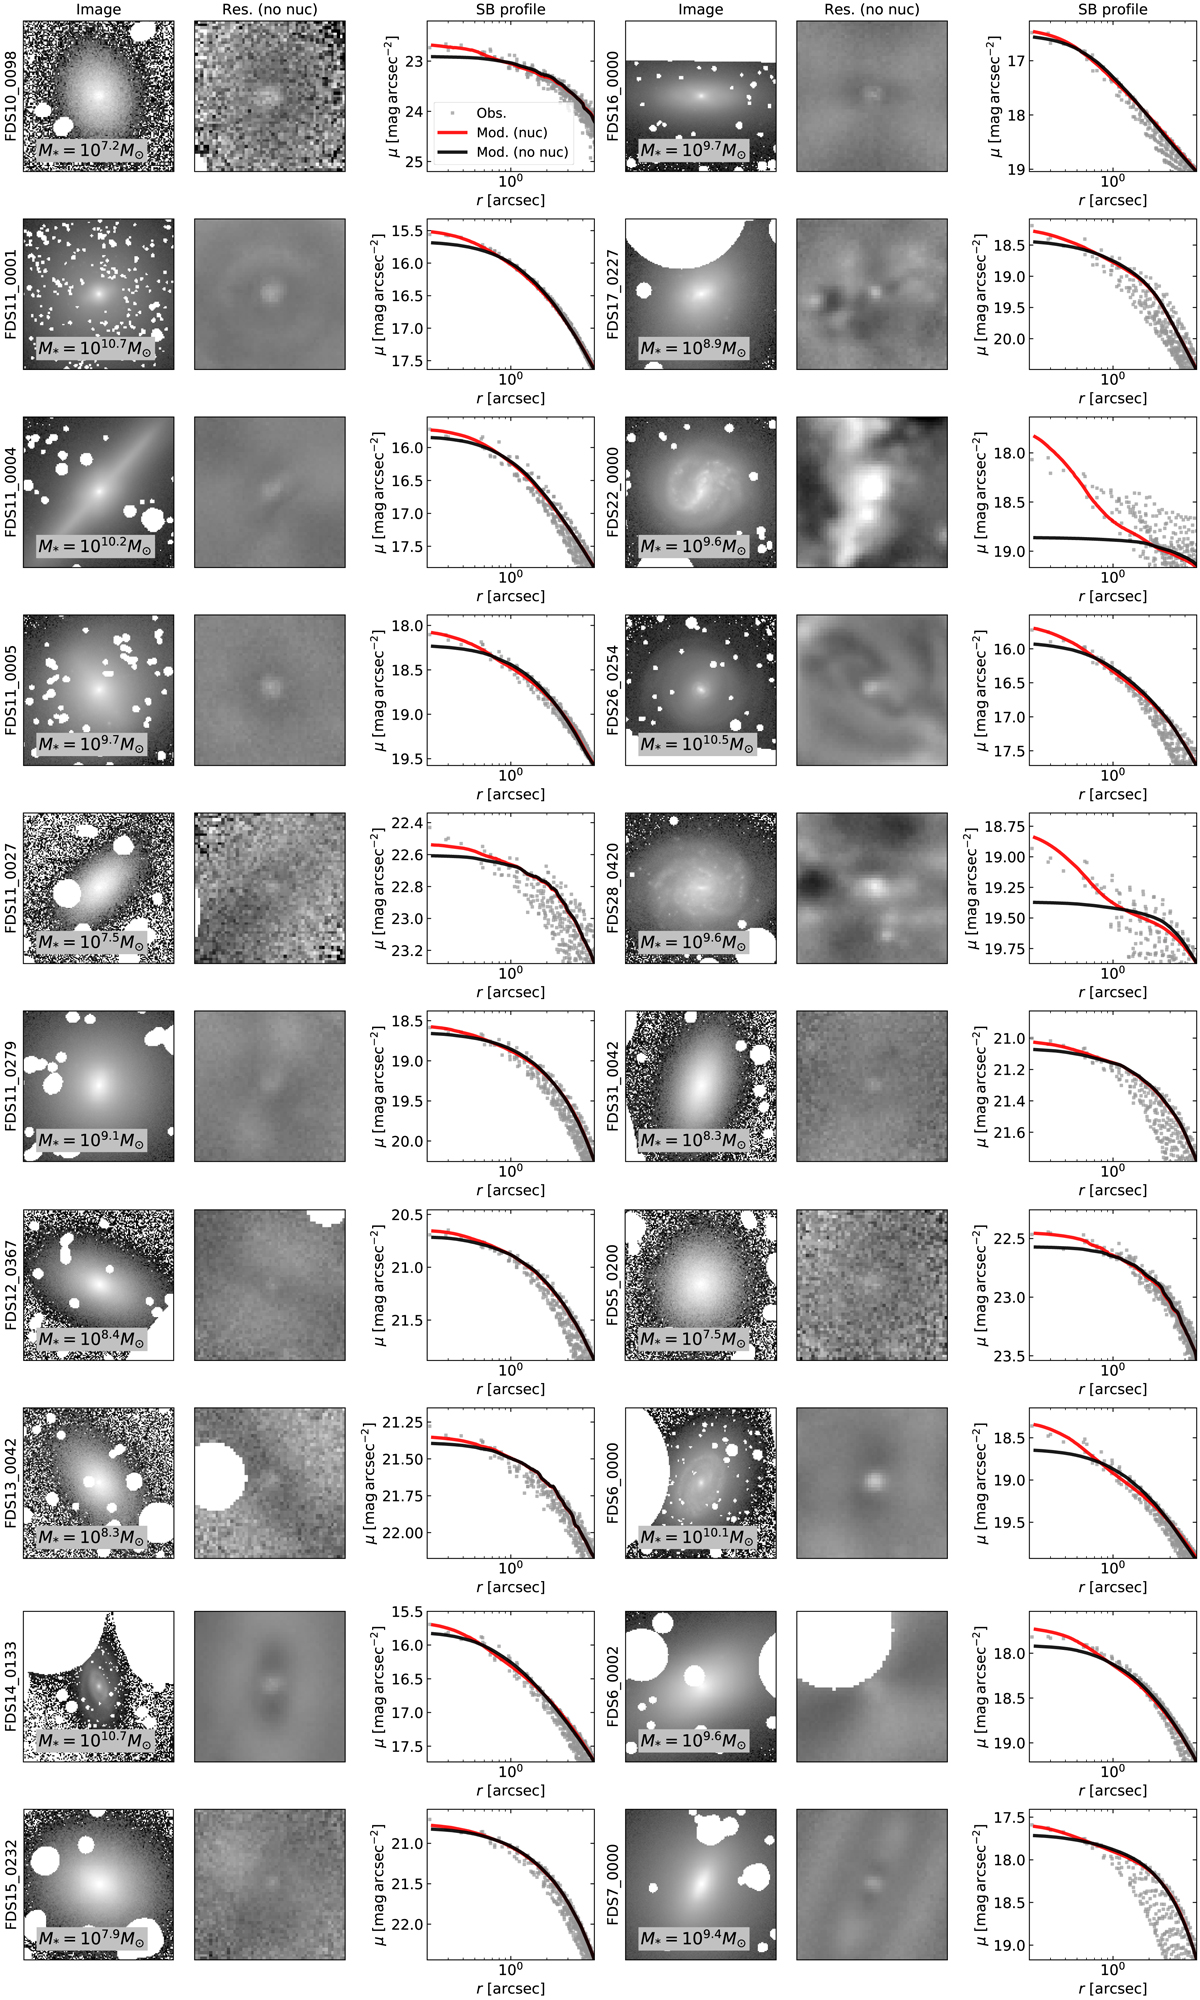
Fig. A.1.
Download original image
Twenty galaxies labelled as nucleated in this work (see Sect. 2.3). Column 1 (4) shows the galaxy images with widths of 5Re, with the galaxy stellar masses annotated. Column 2 (5) shows the residual images (widths of 10 arcsec) based on the multi-component models without a nucleus component. Column 3 (6) shows the galaxy surface brightness from individual pixels (grey) and the azimuthally averaged surface brightness profiles from multi-component models with (red) and without (black) a nucleus component.
Current usage metrics show cumulative count of Article Views (full-text article views including HTML views, PDF and ePub downloads, according to the available data) and Abstracts Views on Vision4Press platform.
Data correspond to usage on the plateform after 2015. The current usage metrics is available 48-96 hours after online publication and is updated daily on week days.
Initial download of the metrics may take a while.