Fig. 17.
Download original image
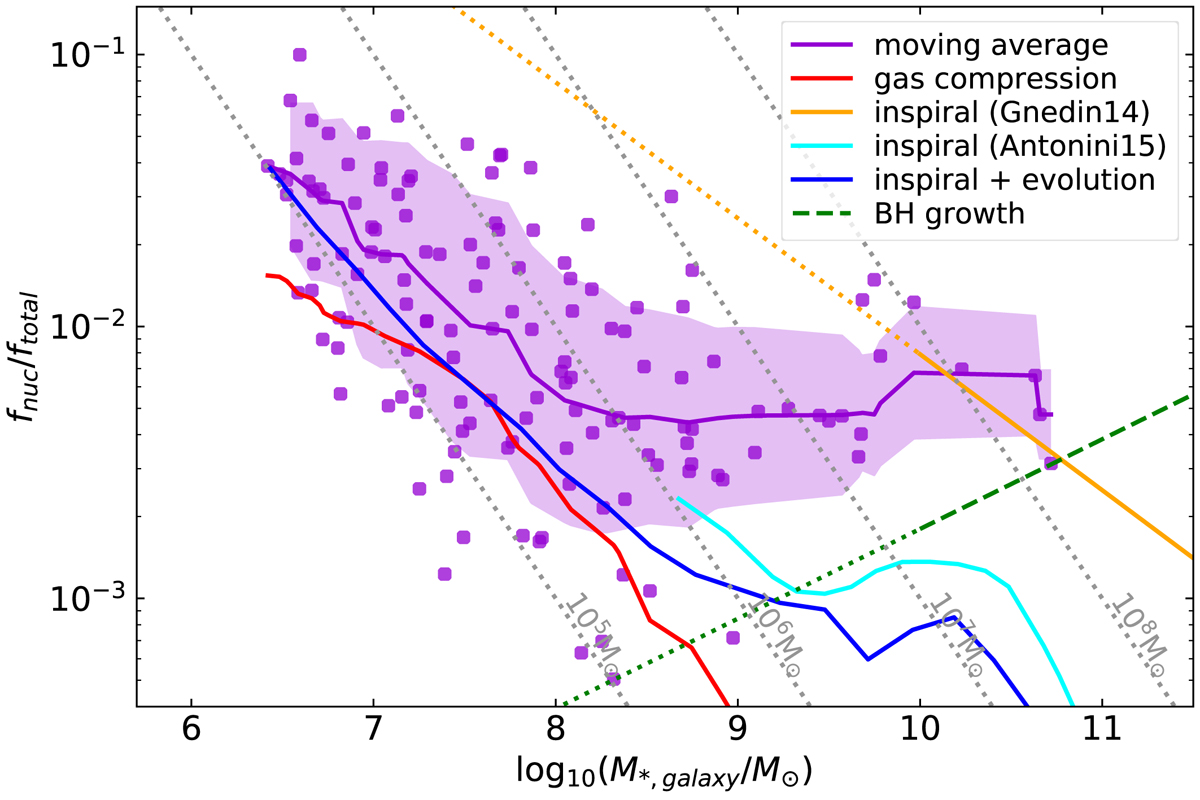
Comparison of different NSC formation mechanisms with our nucleated early-type galaxies. The violet points, solid line, and shaded region denote our nucleated galaxies (same as in Fig. 12). We consider the maximum NSC mass via tidal compression of gas (i.e. an upper limit; red; Emsellem & van de Ven 2008), GC in-spiral (orange and cyan; Gnedin et al. 2014 and Antonini et al. 2015, respectively), and a combination of GC in-spiral and galaxy evolution models (blue; Antonini et al. 2015). The black hole scaling relation (green; Greene et al. 2020) is included to illustrate the evolution of black holes. The dotted portion of the coloured lines denote an extrapolation of the original relation. The dotted grey lines denote constant nucleus stellar masses.
Current usage metrics show cumulative count of Article Views (full-text article views including HTML views, PDF and ePub downloads, according to the available data) and Abstracts Views on Vision4Press platform.
Data correspond to usage on the plateform after 2015. The current usage metrics is available 48-96 hours after online publication and is updated daily on week days.
Initial download of the metrics may take a while.