Fig. 14.
Download original image
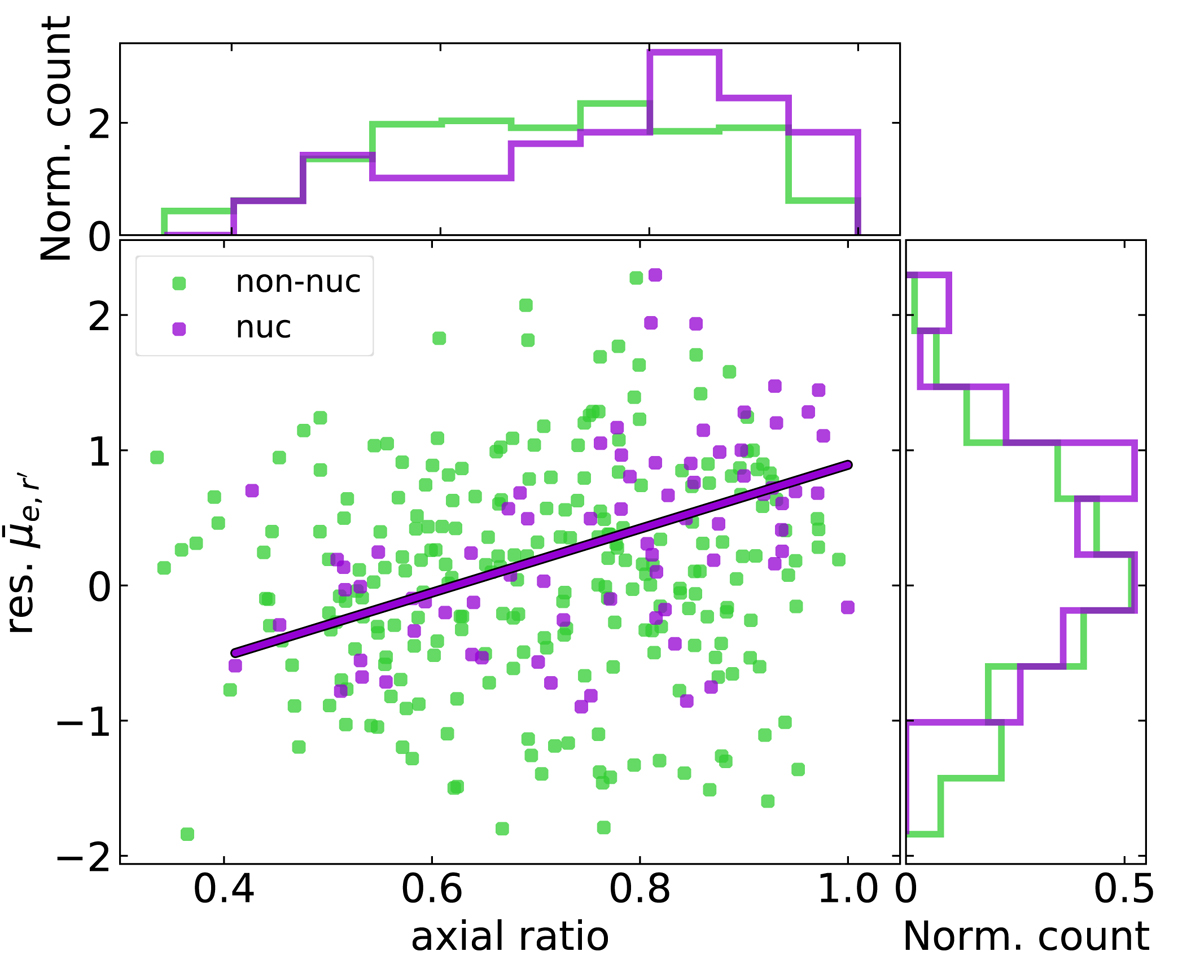
Residual ![]() as a function of the axial ratio of the Sérsic component from Sérsic+PSF models. The points denote nucleated (violet) and non-nucleated (green) galaxies within the stellar mass range of 106.2 < M* < 107.8. The purple line shows the linear fit to the nucleated galaxies. The upper and left sub-plots show the distributions of the axial ratio and residual
as a function of the axial ratio of the Sérsic component from Sérsic+PSF models. The points denote nucleated (violet) and non-nucleated (green) galaxies within the stellar mass range of 106.2 < M* < 107.8. The purple line shows the linear fit to the nucleated galaxies. The upper and left sub-plots show the distributions of the axial ratio and residual ![]() , respectively.
, respectively.
Current usage metrics show cumulative count of Article Views (full-text article views including HTML views, PDF and ePub downloads, according to the available data) and Abstracts Views on Vision4Press platform.
Data correspond to usage on the plateform after 2015. The current usage metrics is available 48-96 hours after online publication and is updated daily on week days.
Initial download of the metrics may take a while.