Fig. 6
Download original image
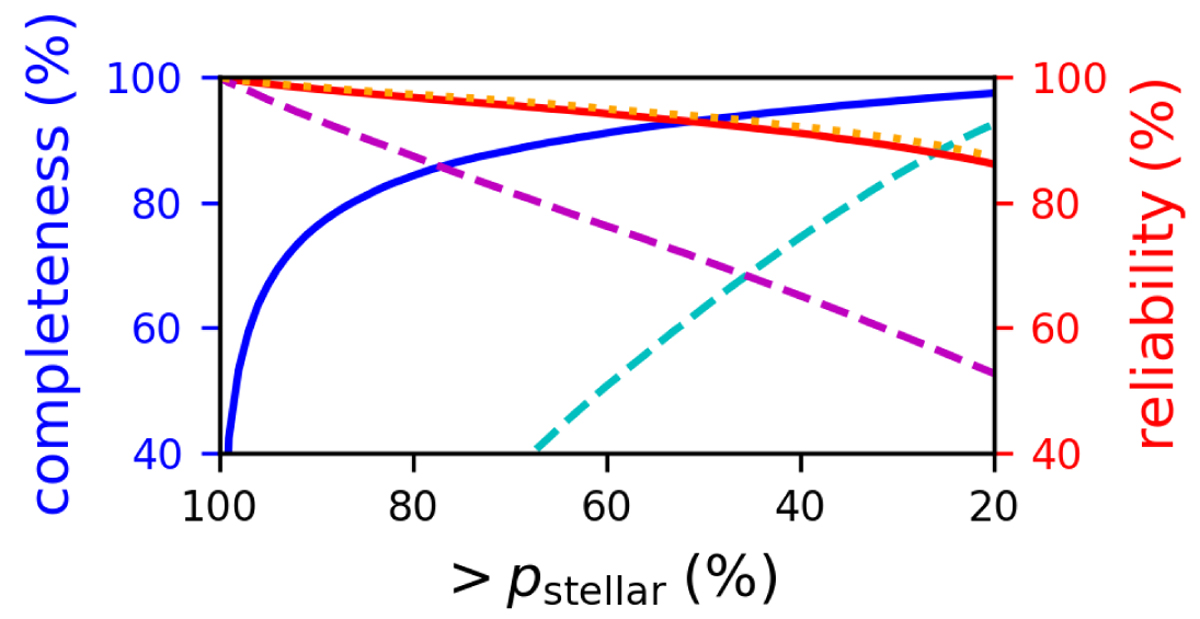
Completeness and reliability of samples with different stellar probability cutoffs. For the dashed cyan and magenta line, only the geometric information is used, while the solid blue and red curves show the completeness and reliability reached when the Bayes map is applied. The dotted orange line shows the reliability expected from shifted RASS sources.
Current usage metrics show cumulative count of Article Views (full-text article views including HTML views, PDF and ePub downloads, according to the available data) and Abstracts Views on Vision4Press platform.
Data correspond to usage on the plateform after 2015. The current usage metrics is available 48-96 hours after online publication and is updated daily on week days.
Initial download of the metrics may take a while.