Fig. 1
Download original image
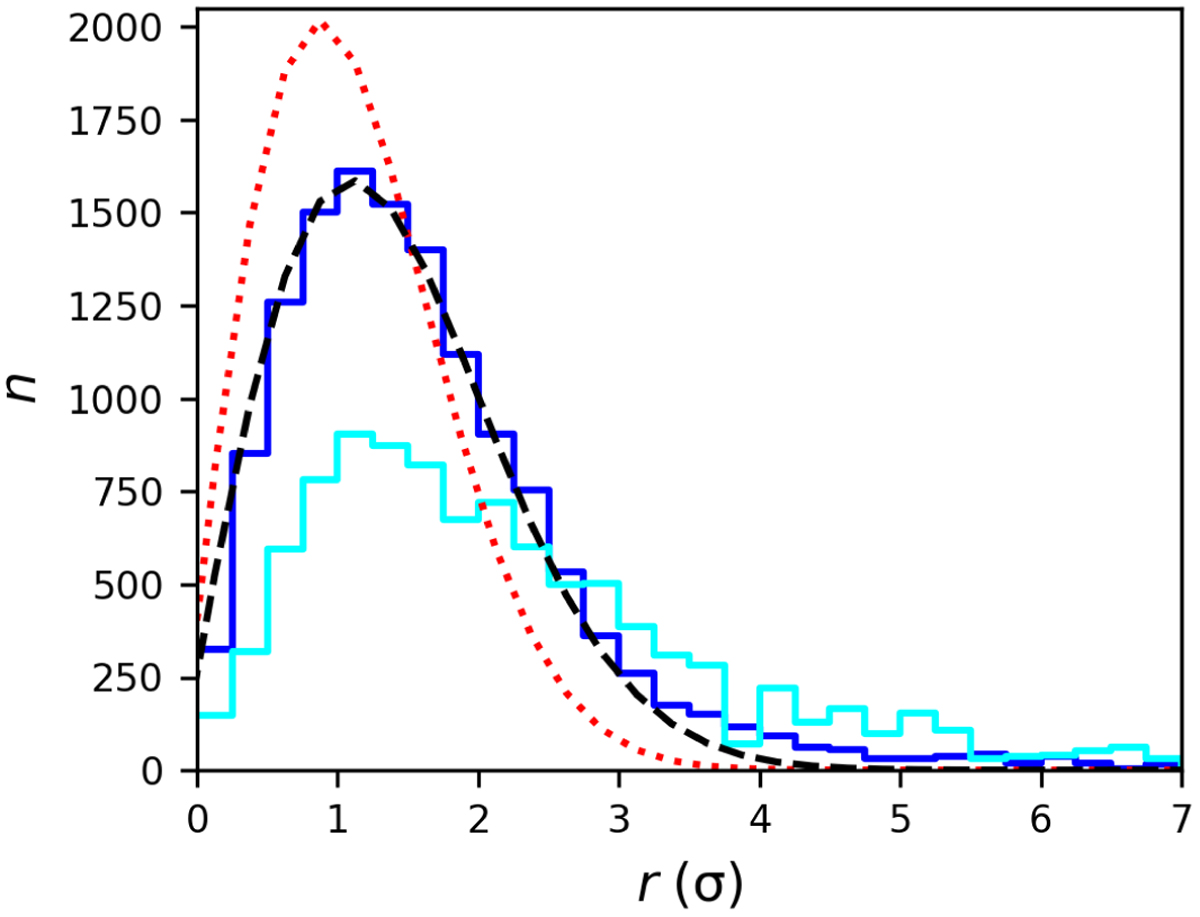
Nearest neighbor distribution for the RASS and the stellar eRASS1 sources as a function of the positional accuracy given in the RASS catalog. The blue and cyan solid histograms show the nearest neighbor distributions for the main and supplement RASS sources (see text for details). Both histograms are normed to the same number of sources. The red and black dashed line show the Rayleigh distribution (Eq. (1)) and the best fit of the blue histogram applying Eq. (2), respectively.
Current usage metrics show cumulative count of Article Views (full-text article views including HTML views, PDF and ePub downloads, according to the available data) and Abstracts Views on Vision4Press platform.
Data correspond to usage on the plateform after 2015. The current usage metrics is available 48-96 hours after online publication and is updated daily on week days.
Initial download of the metrics may take a while.