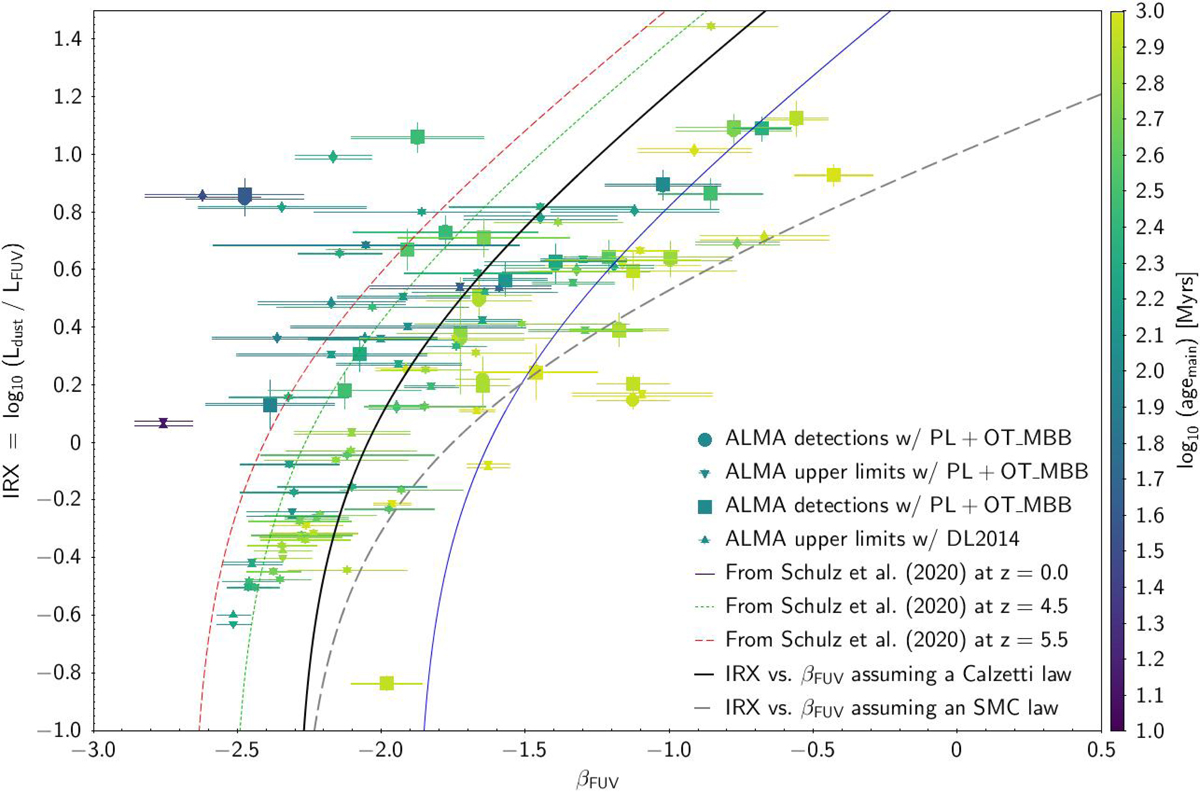
Fig. 9.
Download original image
IRX – βCFUV diagram. IRX values were estimated with CIGALE and βFUV were fitted on the data directly. They are not model-dependant. The black continuous line corresponds to the original Calzetti law, under the assumption that the underlying dust curve follows the Calzetti et al. (2000) attenuation. The dashed line to the predicted law assumes the SMC extinction law (e.g., Gordon et al. 2003). Both are from McLure et al. (2018). The color of the symbols are related to the axis to the right of the figure, the age of the stellar population. Both results with dust emission, DL2014 and PL+OT_MBB, are presented with different symbols with ALMA upper limits and ALMA detections. In the figures, we also plotted the laws from Schulz et al. (2020) at z = 0.0 (blue continuous line), 4.5 (green dotted line), and 5.5 (red dashed line). A comparison with the IRX – βFUV plot in Fudamoto et al. (2020) with the same sample suggests that our (especially ALMA-detected) galaxies extend less to very blue βFUV. This is mainly true for the subsample of galaxies not detected in continuum with ALMA. This is probably due to two effects: first, in Fudamoto et al. (2020), 3σ upper limits are plotted. Another possible effect could be because we used a unique IR composite template in the SED fitting, which reduces the uncertainties on Ldust.
Current usage metrics show cumulative count of Article Views (full-text article views including HTML views, PDF and ePub downloads, according to the available data) and Abstracts Views on Vision4Press platform.
Data correspond to usage on the plateform after 2015. The current usage metrics is available 48-96 hours after online publication and is updated daily on week days.
Initial download of the metrics may take a while.