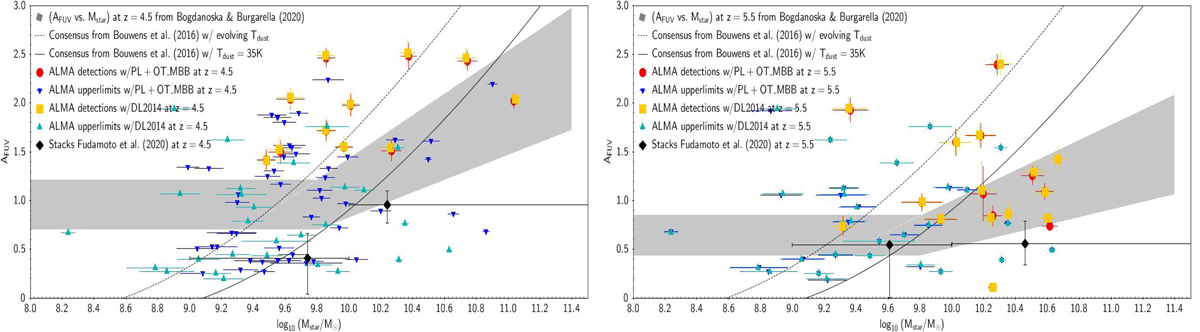
Fig. 8.
Download original image
AFUV − Mstar diagram at z ∼ 4.5 (left) and z ∼ 5.5 (right). The gray areas correspond to the expected relation at z = 4.5 and 5.5 from Bogdanoska & Burgarella (2020). This relation was formed by a broken line, which is flat at log10Mstar ≤ 9.8 and rises at log10 (Mstar) > 9.8. The ALPINE data are very dispersed at z ∼ 4.5, while this flatness is supported by the data at z ∼ 5.5. The conversion from IRX to AFUV is from Burgarella et al. (2005): AFUV = −0.028[log10 (IRX)]3 + 0.392 [log10 (IRX)]2 + 1.094 [log10 (IRX)] + 0.5.
Current usage metrics show cumulative count of Article Views (full-text article views including HTML views, PDF and ePub downloads, according to the available data) and Abstracts Views on Vision4Press platform.
Data correspond to usage on the plateform after 2015. The current usage metrics is available 48-96 hours after online publication and is updated daily on week days.
Initial download of the metrics may take a while.