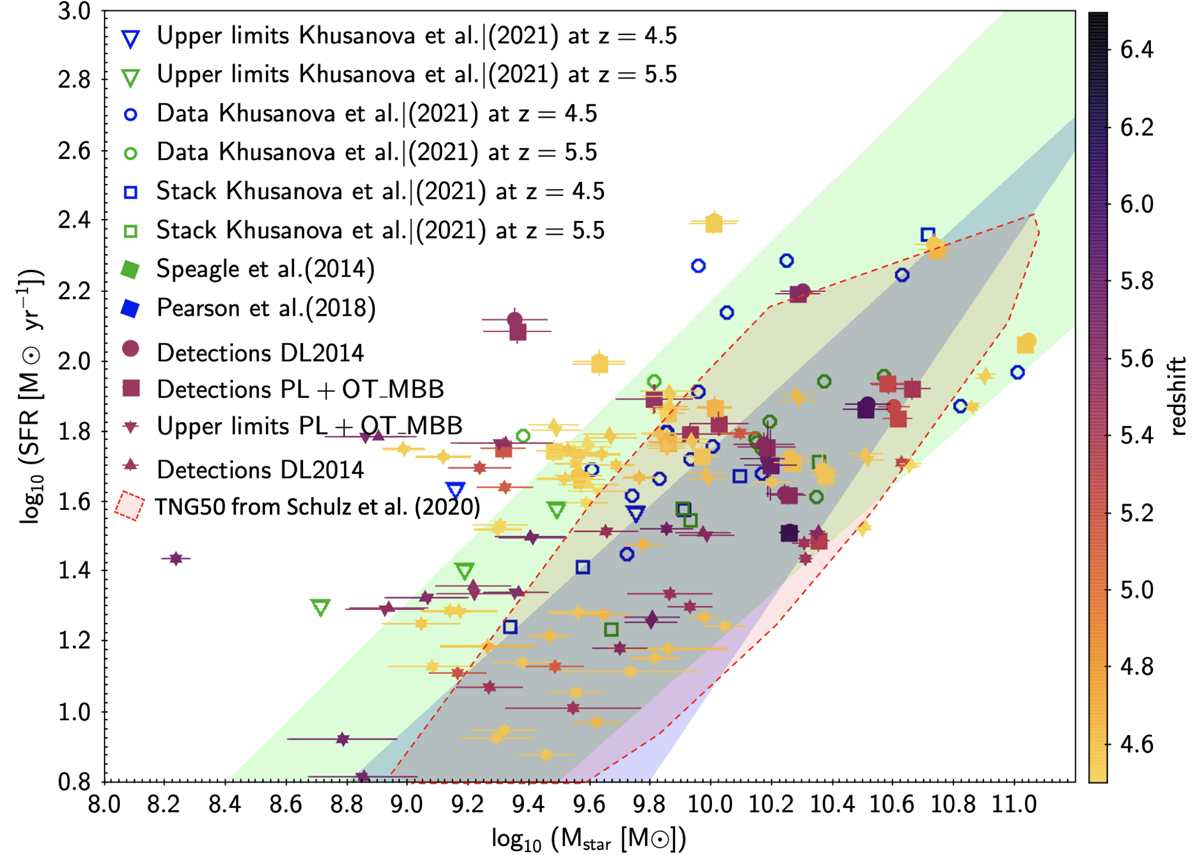
Fig. 7.
Download original image
In the log10 (SFR) vs. log10 (Mstar) diagram, the main part of the sample is found within the limits for the fits of the main sequence at z = 5.0 by Speagle et al. (2014; green shading), by Pearson et al. (2018) at z ∼ 5.2 (purple shading), and by Faisst et al. (2020a), who found that the galaxies are in agreement with Speagle et al. (2014). Is is important to note, however, that some of our objects are at redshifts larger than the 4.5–5.6 ALPINE sample (see color code of the markers). For Speagle et al. (2014), we used the “mixed” (preferred fit)” function (as defined by Speagle et al. 2014). The results from the two fits with DL2014 and PL+OT_MBB are presented. The two types of dust emission do not significantly modify the location of the points in the diagram. Detections are shown as dots and boxes and upper limits are shown as downward- and upward-pointing triangles. The uncertainty range for upper limits extends to the bottom of the plot. In addition to having mainly upper limits, at log10 (Mstar) < 9.5, the sample is very likely incomplete which means that it is difficult to estimate a trend from these data over the entire mass range. We also added the objects and stacks from Khusanova et al. (2021) with open markers. Finally, the selection of TNG50 galaxies used in Schulz et al. (2020) is also provided (red-shaded area).
Current usage metrics show cumulative count of Article Views (full-text article views including HTML views, PDF and ePub downloads, according to the available data) and Abstracts Views on Vision4Press platform.
Data correspond to usage on the plateform after 2015. The current usage metrics is available 48-96 hours after online publication and is updated daily on week days.
Initial download of the metrics may take a while.