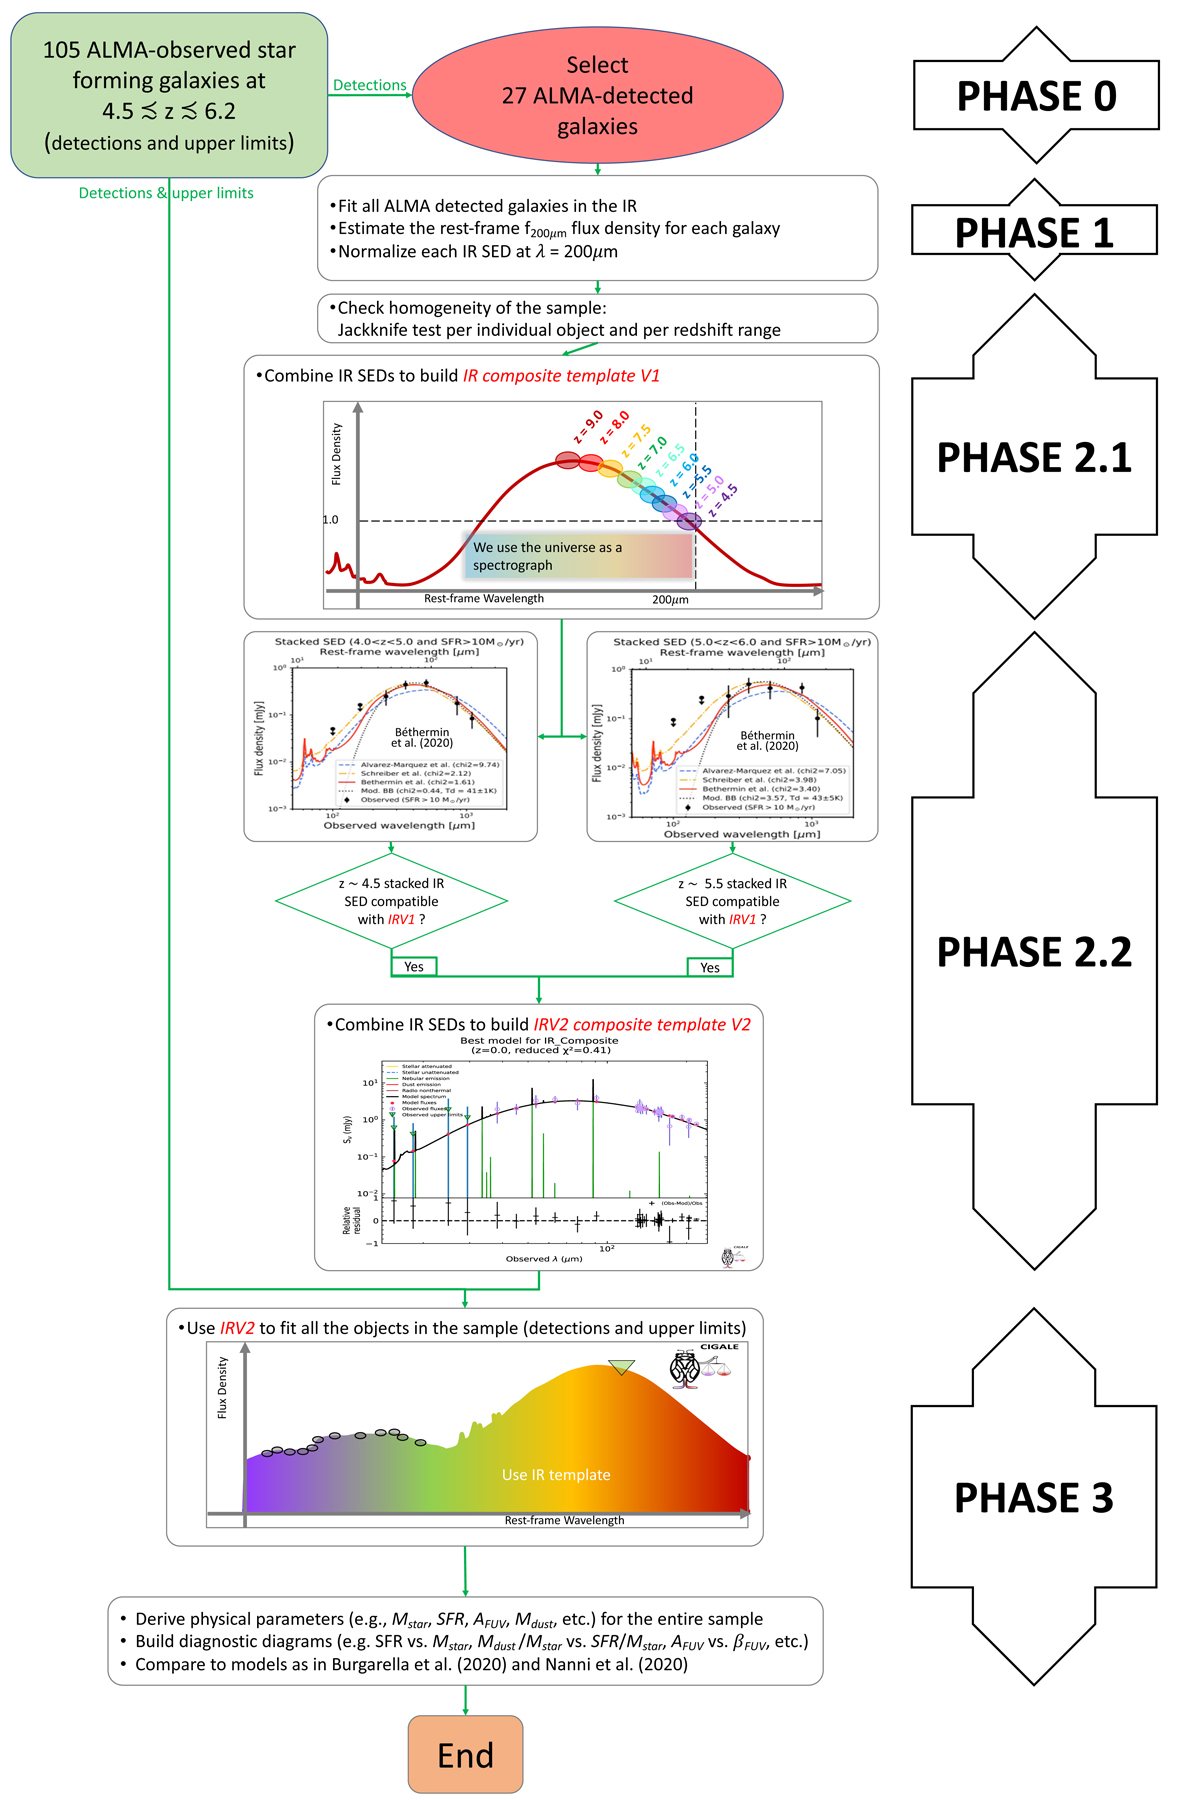
Fig. 1.
Download original image
Flow chart of the process followed to build the composite IR SED for the Hiz-SFGs sample. The various phases of this process are shown on the right side of the figures. They are also described in more detail in the text (see Sect. 3) In the first phase, we selected only ALMA-detected objects to build the first IR template (IRV1). Next, we added the data from the z ∼ 4.5 and ∼5.5 stacks from Bethermin et al. (2020) to build the second and final IR template (IRV2). Adding UV and optical data to IRV2, we fit the entire (detected and upper limits) sample.
Current usage metrics show cumulative count of Article Views (full-text article views including HTML views, PDF and ePub downloads, according to the available data) and Abstracts Views on Vision4Press platform.
Data correspond to usage on the plateform after 2015. The current usage metrics is available 48-96 hours after online publication and is updated daily on week days.
Initial download of the metrics may take a while.