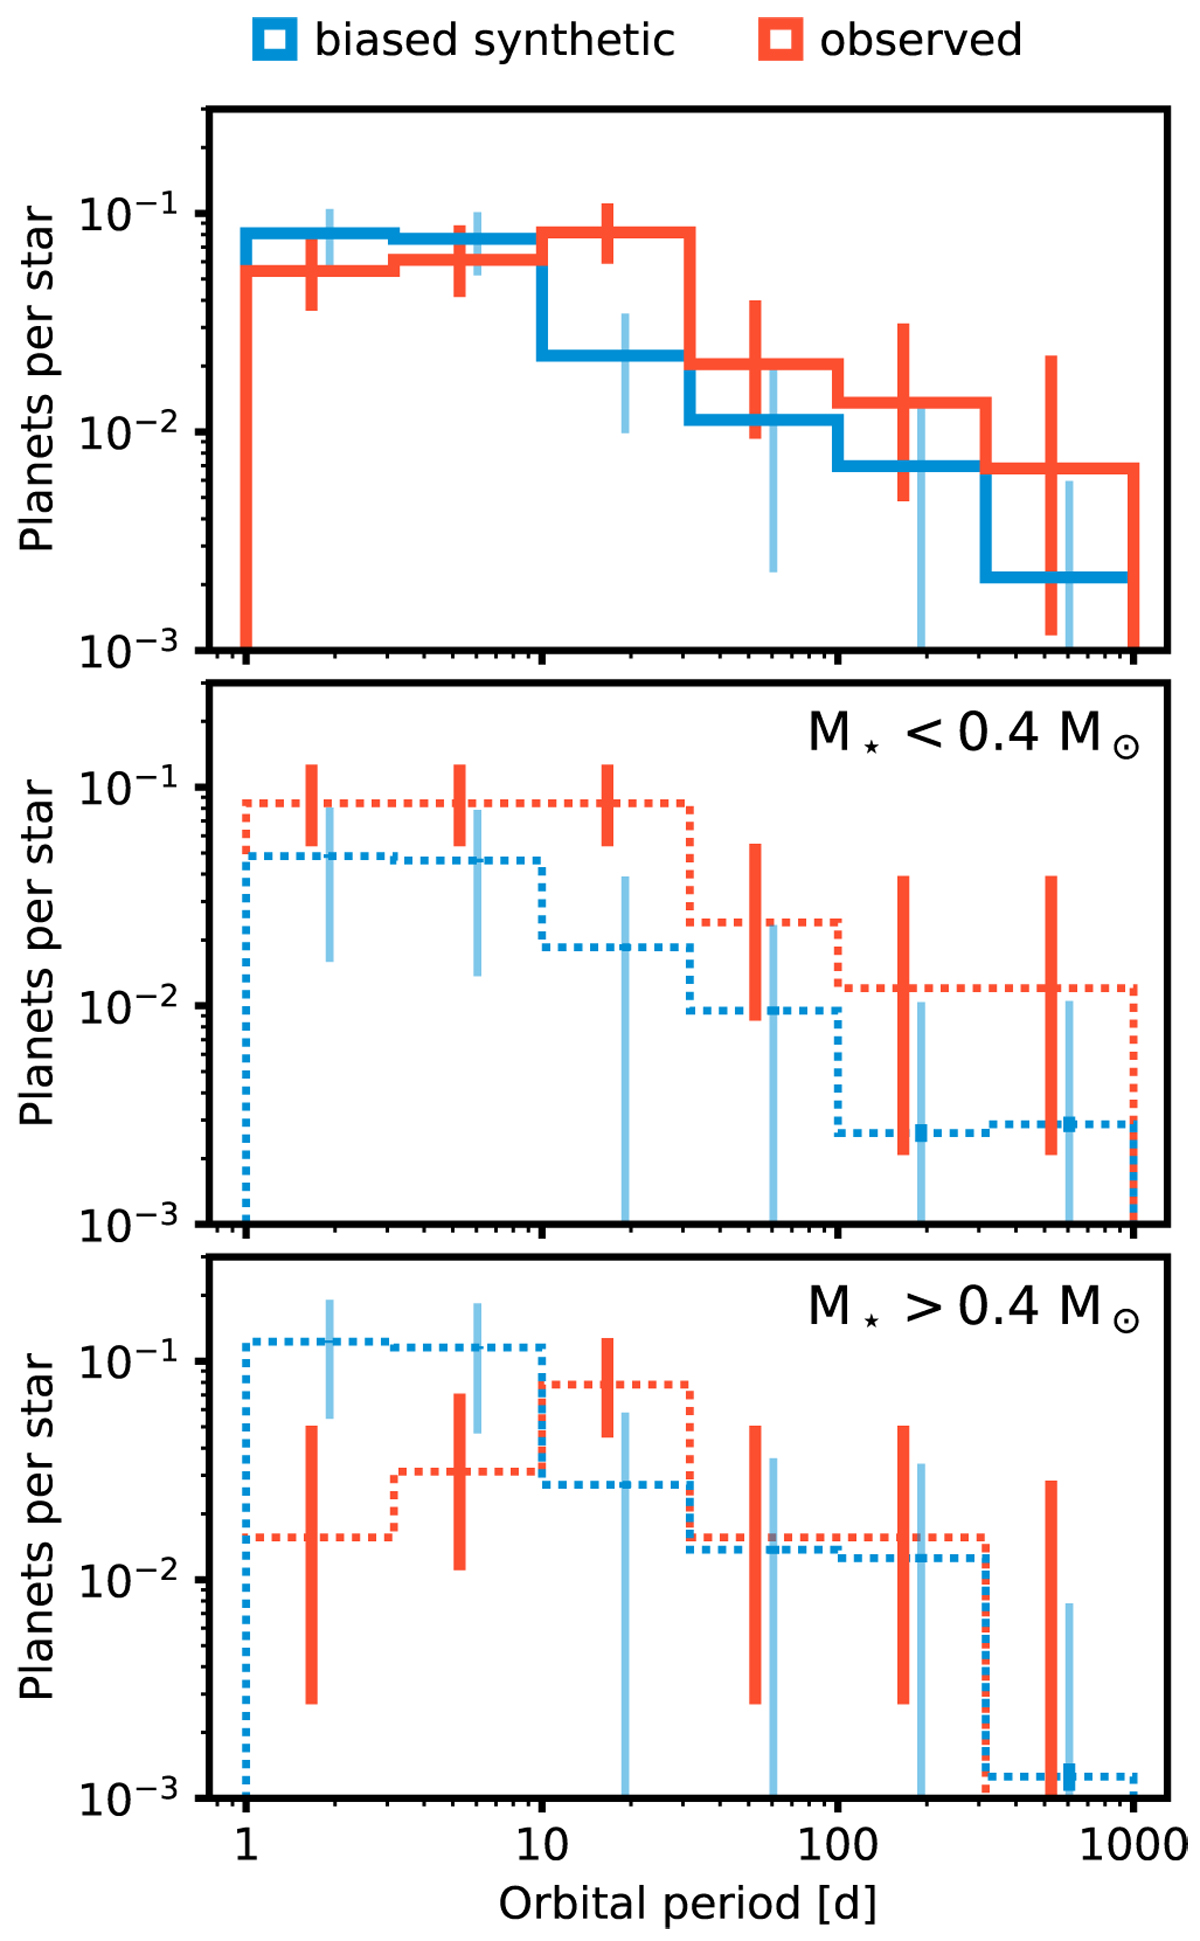
Fig. 7
Download original image
Period distribution of observed and synthetic planets. As in Fig. 6, thick error bars denote 68% confidence intervals based on the binomial distribution, and thin lines show the standard deviations of bootstrapped simulated samples. Top: total normalized counts. The distributions are comparable over most of the range, except for a peak at ~10–30 d that only occurs in the observed sample. Center and bottom: nNormalized counts for early (>0.4 M⊙) and late (<0.4 M⊙) M dwarfs separately, both showing a high detection rate at a few tens of days in the observed sample. Significantly fewer short-period planets are found around higher-mass stars, which is in disagreement with our model.
Current usage metrics show cumulative count of Article Views (full-text article views including HTML views, PDF and ePub downloads, according to the available data) and Abstracts Views on Vision4Press platform.
Data correspond to usage on the plateform after 2015. The current usage metrics is available 48-96 hours after online publication and is updated daily on week days.
Initial download of the metrics may take a while.