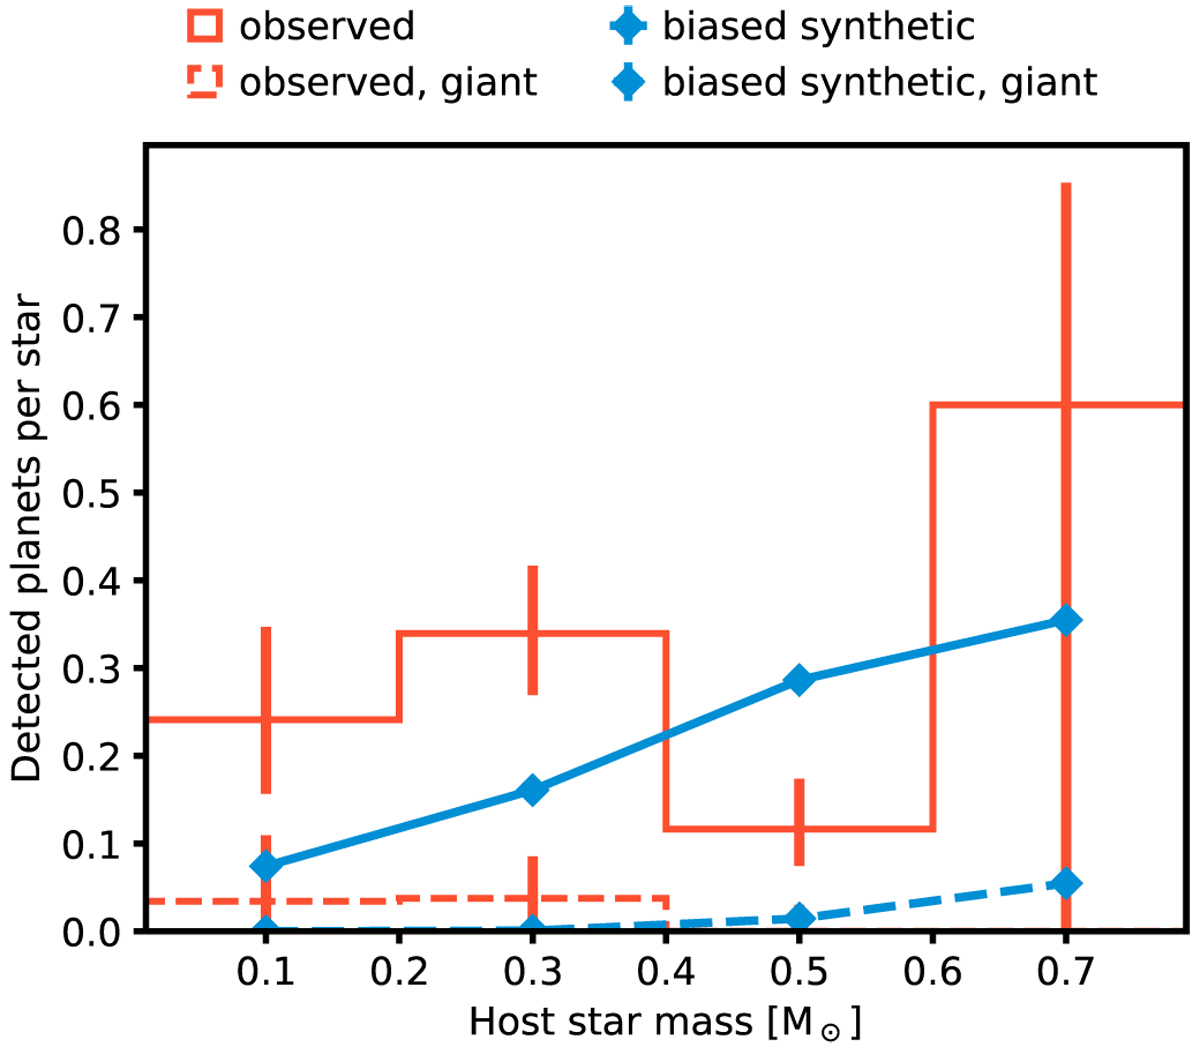
Fig. 5
Download original image
Simulated and observed planet detections as a function of host star mass. In each stellar mass bin, vertical lines denote 68% confidence intervals based on the binomial distribution (not visible for the synthetic population), and the counts are normalized to the number of stars in that bin. The synthetic population features discrete M* values and shows a linear increase of detections with increasing stellar mass. The observed sample shows no clear trend.
Current usage metrics show cumulative count of Article Views (full-text article views including HTML views, PDF and ePub downloads, according to the available data) and Abstracts Views on Vision4Press platform.
Data correspond to usage on the plateform after 2015. The current usage metrics is available 48-96 hours after online publication and is updated daily on week days.
Initial download of the metrics may take a while.