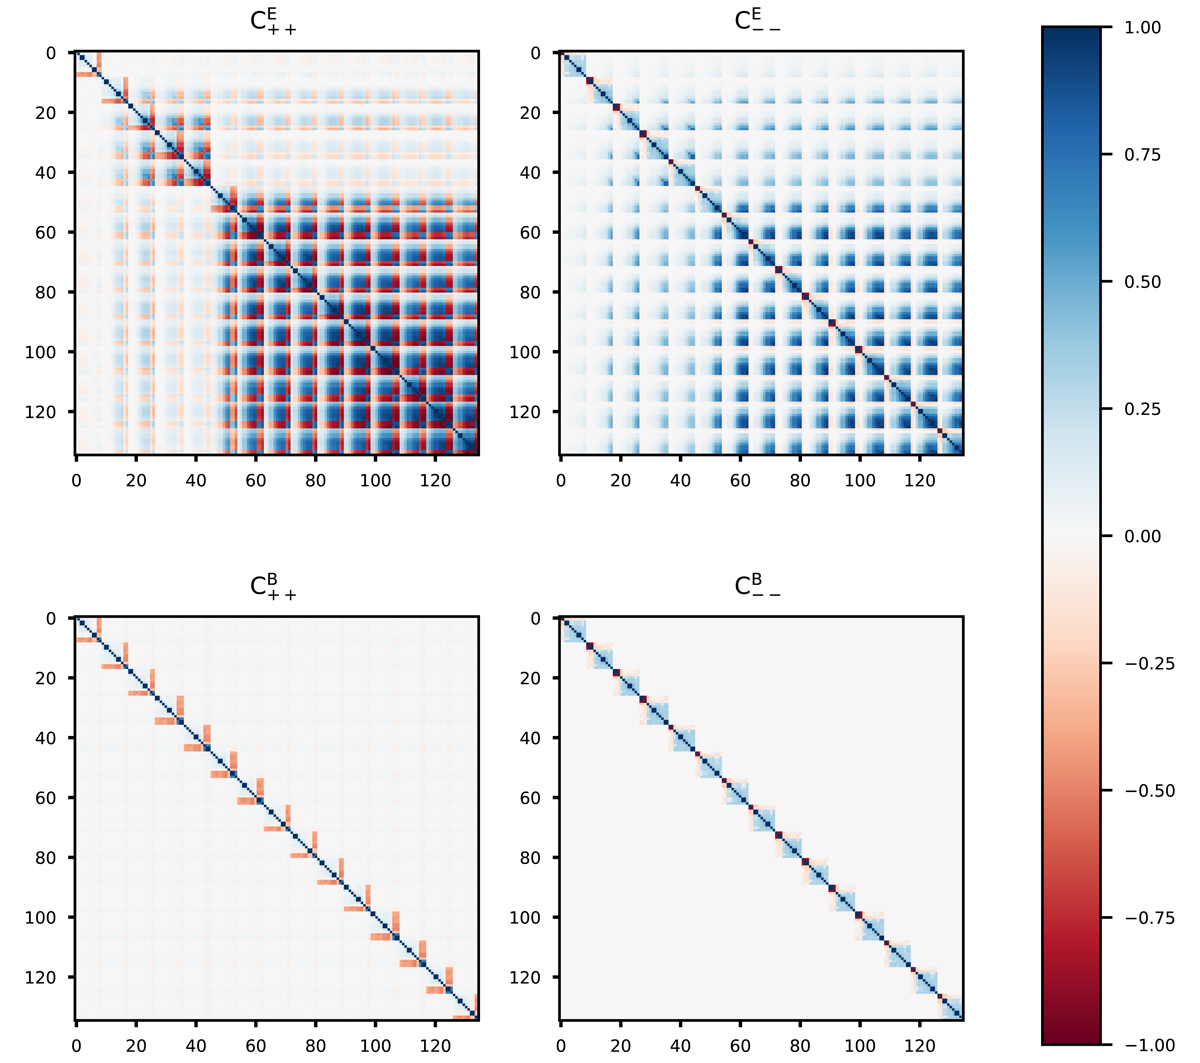
Fig. 8.
Download original image
Correlation coefficients for pure-mode correlation functions. They are shown for the autocorrelations of ![]() (top left),
(top left), ![]() (top right),
(top right), ![]() (bottom left), and
(bottom left), and ![]() (bottom right). The covariance matrices are calculated for nine θ bins and five redshift bins, resulting in 15 distinct pairs of redshifts. Top-left corner of each panel shows the correlation coefficients for the lowest-redshift bins.
(bottom right). The covariance matrices are calculated for nine θ bins and five redshift bins, resulting in 15 distinct pairs of redshifts. Top-left corner of each panel shows the correlation coefficients for the lowest-redshift bins.
Current usage metrics show cumulative count of Article Views (full-text article views including HTML views, PDF and ePub downloads, according to the available data) and Abstracts Views on Vision4Press platform.
Data correspond to usage on the plateform after 2015. The current usage metrics is available 48-96 hours after online publication and is updated daily on week days.
Initial download of the metrics may take a while.