Fig. 4.
Download original image
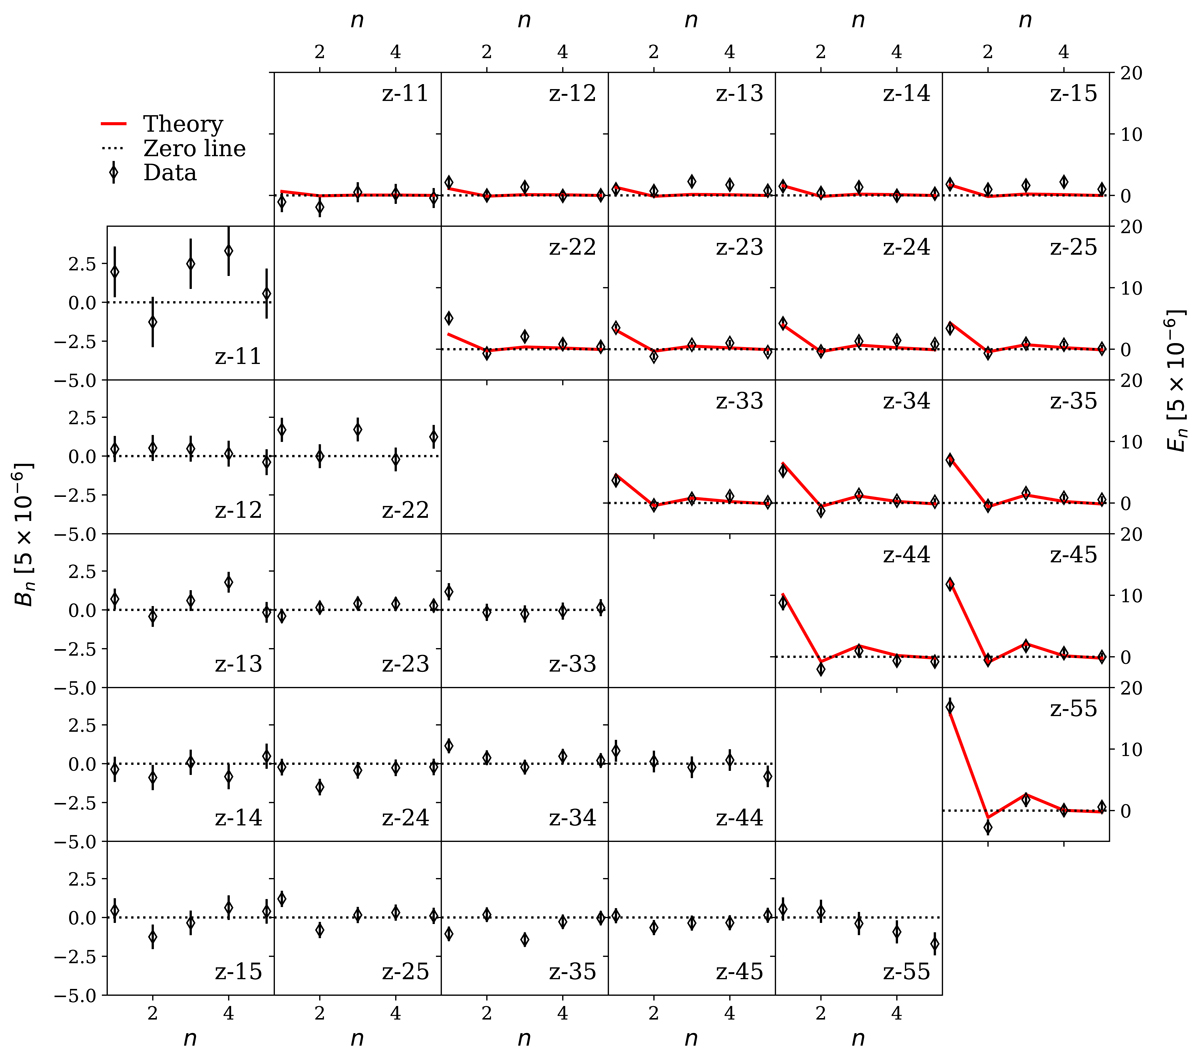
Dimensionless logarithmic COSEBI (see Appendix B) measurements from KiDS-1000 data. The E and B modes are shown in the top and bottom triangles, respectively. Each panel depicts results for a pair of redshift bins, z − ij. The solid red curves correspond to the best fitting model to the SEK COSEBIs as analyzed in Asgari et al. (2021, compare with their Fig. 3). The B modes are consistent with zero (p-value = 0.36) and the best-fit model describes the data very well (p-value = 0.2). We note that the COSEBI modes are discrete and the points are connected to one another for visual aid.
Current usage metrics show cumulative count of Article Views (full-text article views including HTML views, PDF and ePub downloads, according to the available data) and Abstracts Views on Vision4Press platform.
Data correspond to usage on the plateform after 2015. The current usage metrics is available 48-96 hours after online publication and is updated daily on week days.
Initial download of the metrics may take a while.