Fig. 8.
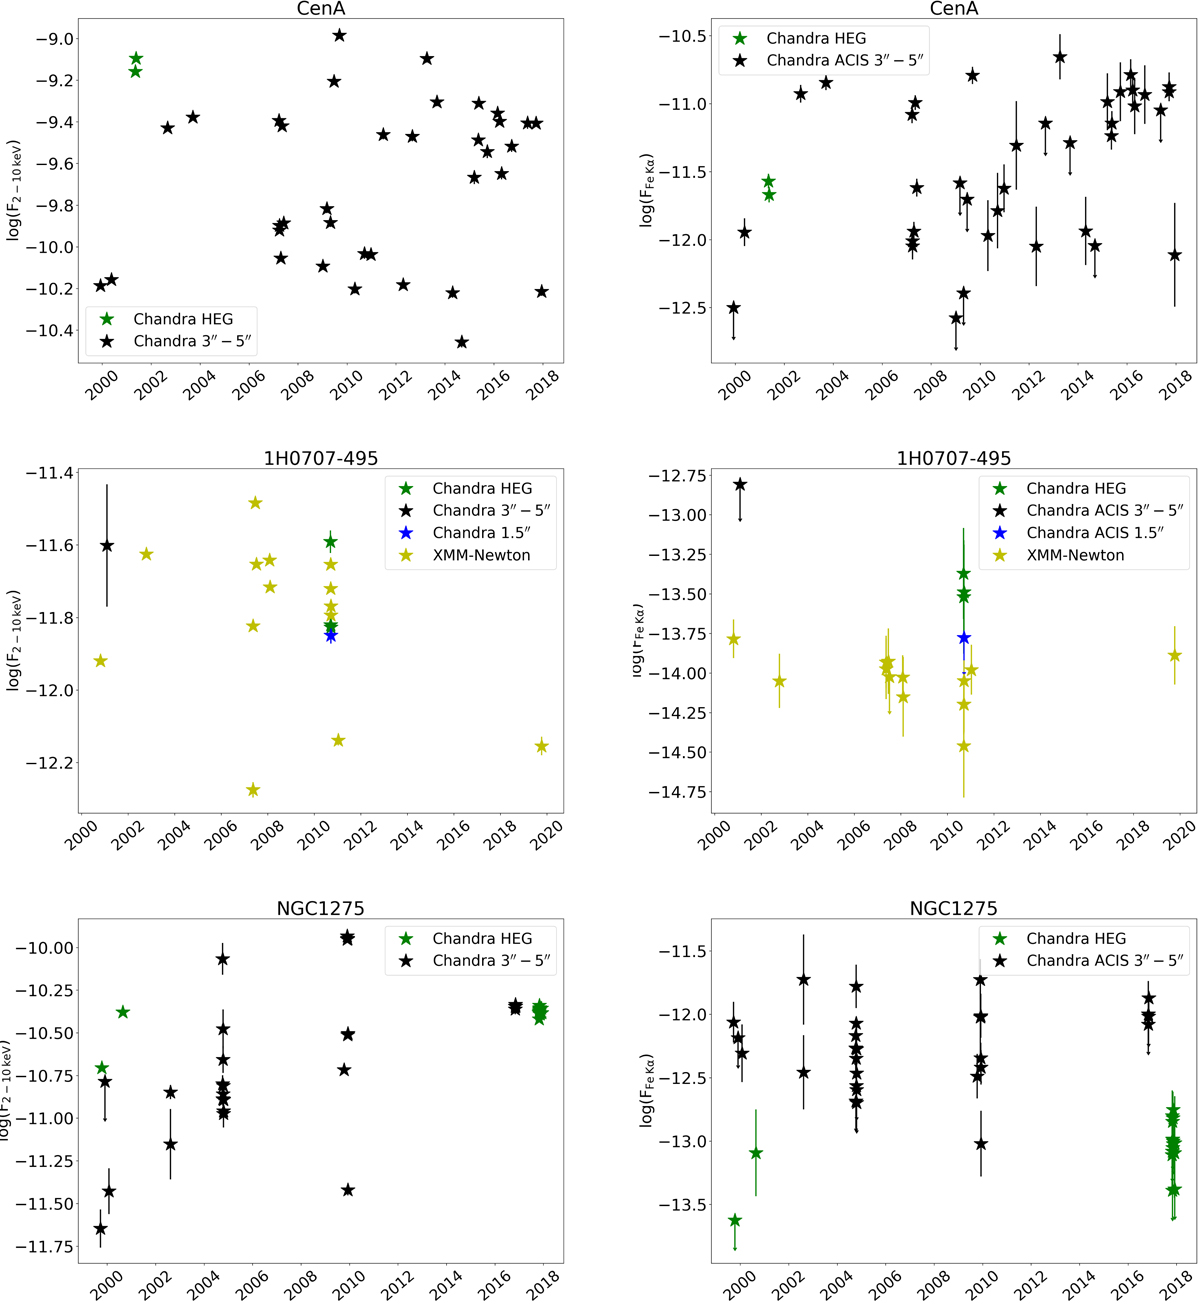
Download original image
Light curves for the 2–10 keV continuum (left) and Fe Kα line (right) fluxes for the galaxy Centaurus A (upper panels), 1H0707-495 (middle panels) and NGC 1275 (lower panels). The green and black stars denote fluxes measured from the Chandra HEG first-order spectra and Chandra ACIS 3″–5″ annular spectra, respectively, while yellow stars are fluxes measured from XMM-Newton pn observations. The flux units are erg cm−2 s−1 and the error plotted are 1σ confidence.
Current usage metrics show cumulative count of Article Views (full-text article views including HTML views, PDF and ePub downloads, according to the available data) and Abstracts Views on Vision4Press platform.
Data correspond to usage on the plateform after 2015. The current usage metrics is available 48-96 hours after online publication and is updated daily on week days.
Initial download of the metrics may take a while.