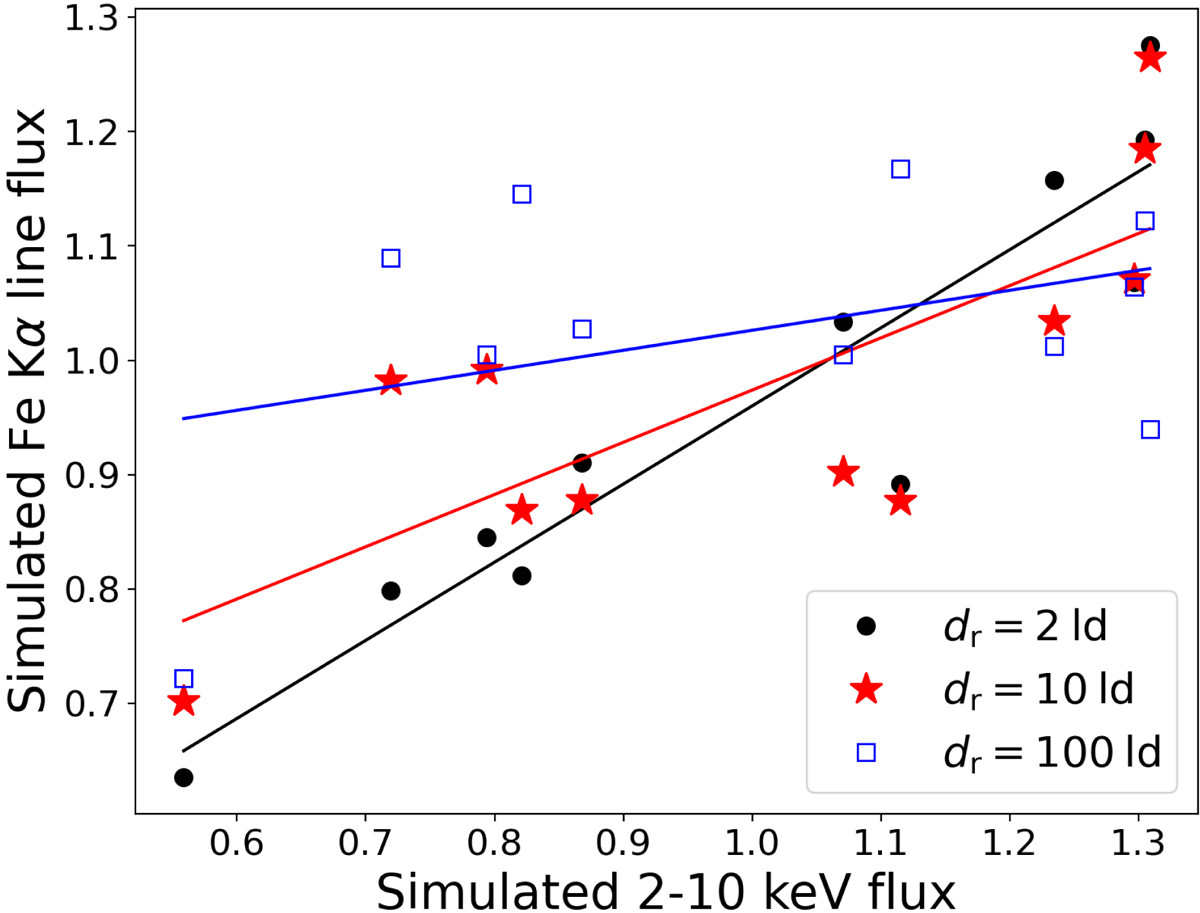
Fig. 7.
Download original image
Comparison of simulated Fe Kα and 2–10 keV continuum mean-normalized fluxes. The continuum simulations use a power-spectral bend timescale of 10 days, while three different reprocessor diameters (dr) are chosen: 2 light days (black dots), 10 light days (red stars) and 100 light days (blue open squares). The simulated light curves are resampled using the observing epochs shown in Fig. 6. The different sets highlight how varying the reprocessor size can damp potential flux-flux correlations. Evidently, the larger the reprocessor, the larger the scatter in the flux-flux relation, and the flatter the best fitting linear regression (solid lines with corresponding colors).
Current usage metrics show cumulative count of Article Views (full-text article views including HTML views, PDF and ePub downloads, according to the available data) and Abstracts Views on Vision4Press platform.
Data correspond to usage on the plateform after 2015. The current usage metrics is available 48-96 hours after online publication and is updated daily on week days.
Initial download of the metrics may take a while.