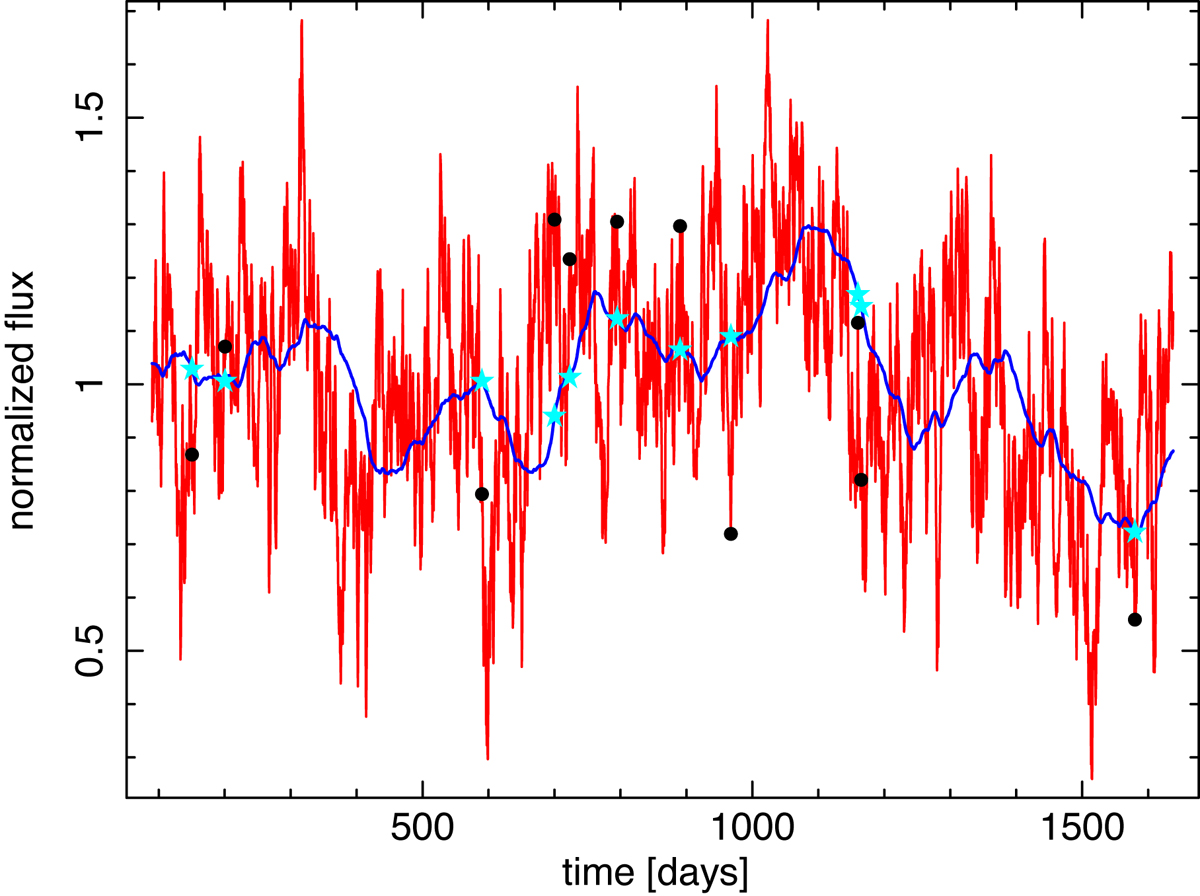
Fig. 6.
Download original image
Example light curve realizations of the continuum (red) and reflected light (blue), which correspond to the power-spectral models plotted in Fig. 5. The reflected light curve reduces variability amplitude and is delayed by 50 days. Increasing the size of the reflector further reduces the amplitude of the reflected light curve and shifts it further forward in time. A random selection of observing epochs are plotted, representing measurements of the continuum (black dots) and Fe Kα line (cyan stars) fluxes. The sampled light curves are not obviously correlated, although the parent light curves are.
Current usage metrics show cumulative count of Article Views (full-text article views including HTML views, PDF and ePub downloads, according to the available data) and Abstracts Views on Vision4Press platform.
Data correspond to usage on the plateform after 2015. The current usage metrics is available 48-96 hours after online publication and is updated daily on week days.
Initial download of the metrics may take a while.