Fig. 5.
Download original image
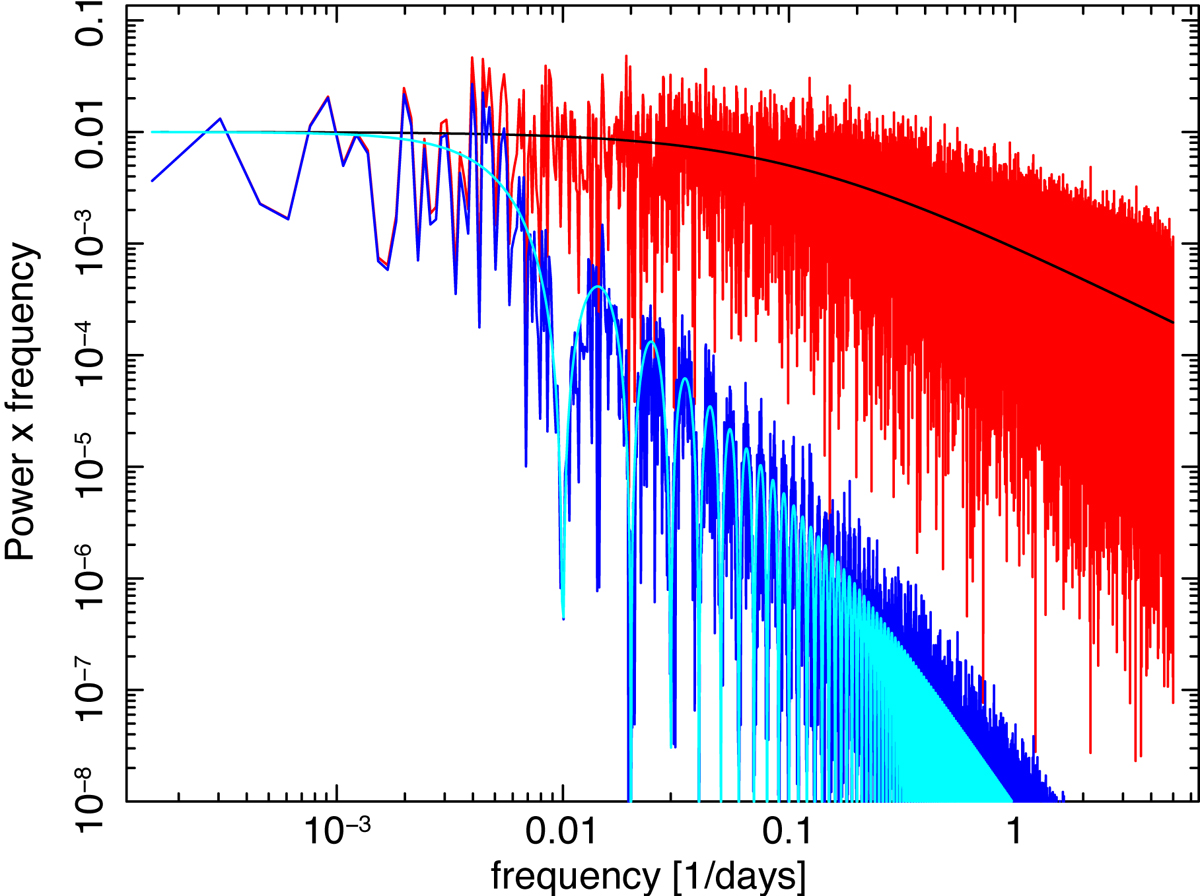
Power spectra of simulated X-ray light curves. The underlying power-spectral shape of the continuum was chosen as a bending powerlaw model with a bend timescale of 10 days (black) and a given realization of this model produces the power spectrum plotted in red. Reflecting the light curves over a spherical reflector of radius R = 50 light days suppresses the high frequency power and results in the model and realization plotted in cyan and blue, respectively.
Current usage metrics show cumulative count of Article Views (full-text article views including HTML views, PDF and ePub downloads, according to the available data) and Abstracts Views on Vision4Press platform.
Data correspond to usage on the plateform after 2015. The current usage metrics is available 48-96 hours after online publication and is updated daily on week days.
Initial download of the metrics may take a while.