Fig. 4.
Download original image
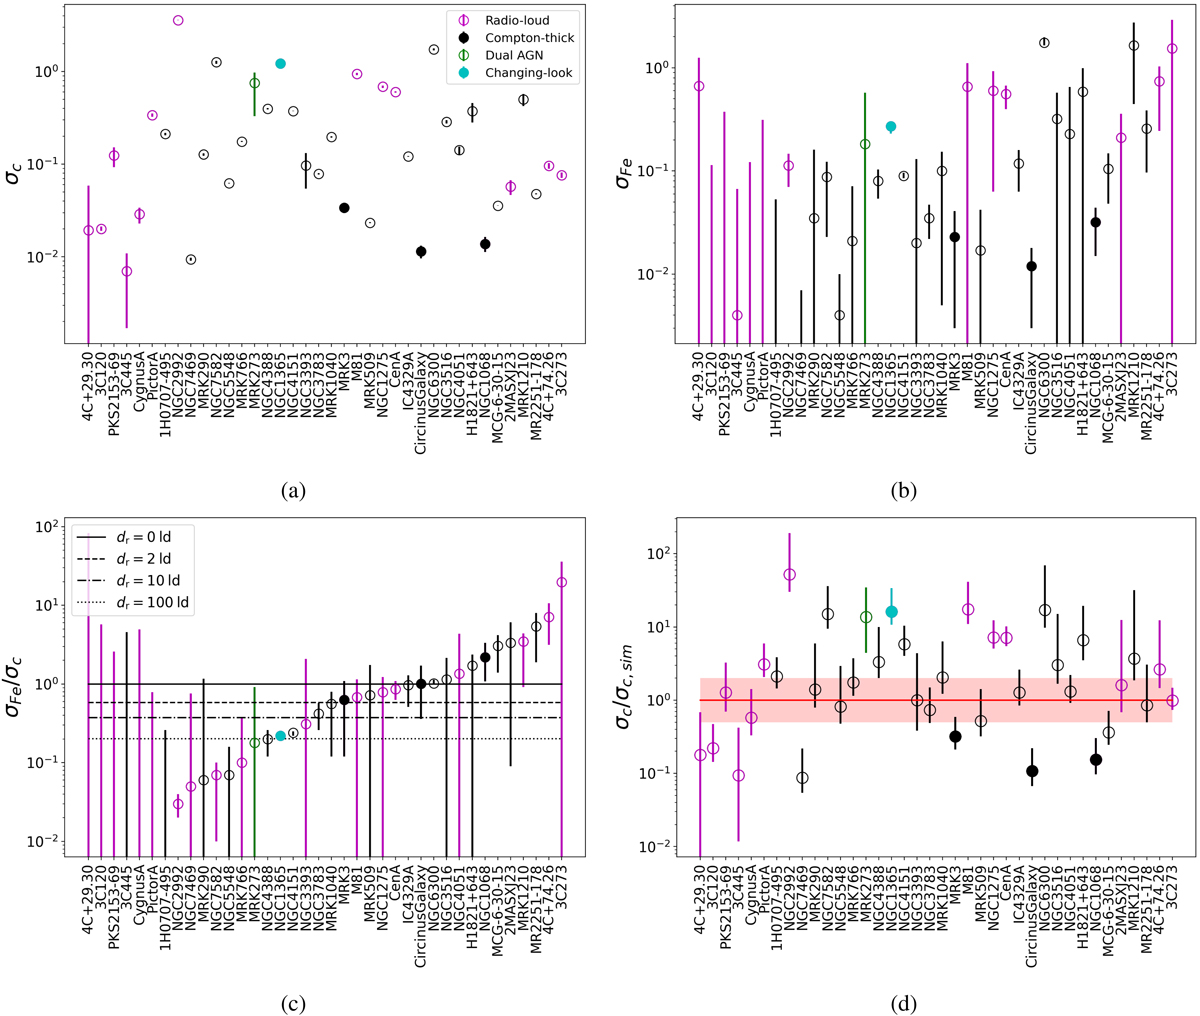
Variability properties of the sample. Sources are ordered based on the ratio between the excess variances of the continuum and the Fe Kα line, ![]() . All four plots adopt the same color code as in Fig. 4a. Open black circles denote AGN without a special characteristic, magenta empty circles are radio-loud AGN, black filled circles are CTȦGN, green empty circles are dual AGN, and filled cyan circles are changing-look AGN. (a): normalized excess variance of the continuum light curves. (b): normalized excess variance of the Fe Kα line light curves. (c): the ratio between the normalized excess variance of the Fe Kα line and continuum light curves, where the four horizontal lines denote ratio for simulated reprocessors with diameters dr = 0,2,10,100 ld, assuming identical 10 days power-spectral bend timescales. (d): ratio between the normalized excess variance of the simulated and real continuum light curves, with unity denoted by the red line. The light red shaded region denotes up to a factor 2 error in our assumed normalization of the simulated power-spectral model. Magenta empty circles are radio-loud sources, black filled circles are Compton-thick sources, green empty circles represents dual AGN, and cyan empty circles are changing-look AGN. Mrk 3 is both Compton-thick and radio-loud, while NGC 1365 is both radio-loud and changing-look. Plotted values represent the median of each parameter while the error bars correspond to the 16% and 84% bounds of the normalized excess variance distributions.
. All four plots adopt the same color code as in Fig. 4a. Open black circles denote AGN without a special characteristic, magenta empty circles are radio-loud AGN, black filled circles are CTȦGN, green empty circles are dual AGN, and filled cyan circles are changing-look AGN. (a): normalized excess variance of the continuum light curves. (b): normalized excess variance of the Fe Kα line light curves. (c): the ratio between the normalized excess variance of the Fe Kα line and continuum light curves, where the four horizontal lines denote ratio for simulated reprocessors with diameters dr = 0,2,10,100 ld, assuming identical 10 days power-spectral bend timescales. (d): ratio between the normalized excess variance of the simulated and real continuum light curves, with unity denoted by the red line. The light red shaded region denotes up to a factor 2 error in our assumed normalization of the simulated power-spectral model. Magenta empty circles are radio-loud sources, black filled circles are Compton-thick sources, green empty circles represents dual AGN, and cyan empty circles are changing-look AGN. Mrk 3 is both Compton-thick and radio-loud, while NGC 1365 is both radio-loud and changing-look. Plotted values represent the median of each parameter while the error bars correspond to the 16% and 84% bounds of the normalized excess variance distributions.
Current usage metrics show cumulative count of Article Views (full-text article views including HTML views, PDF and ePub downloads, according to the available data) and Abstracts Views on Vision4Press platform.
Data correspond to usage on the plateform after 2015. The current usage metrics is available 48-96 hours after online publication and is updated daily on week days.
Initial download of the metrics may take a while.