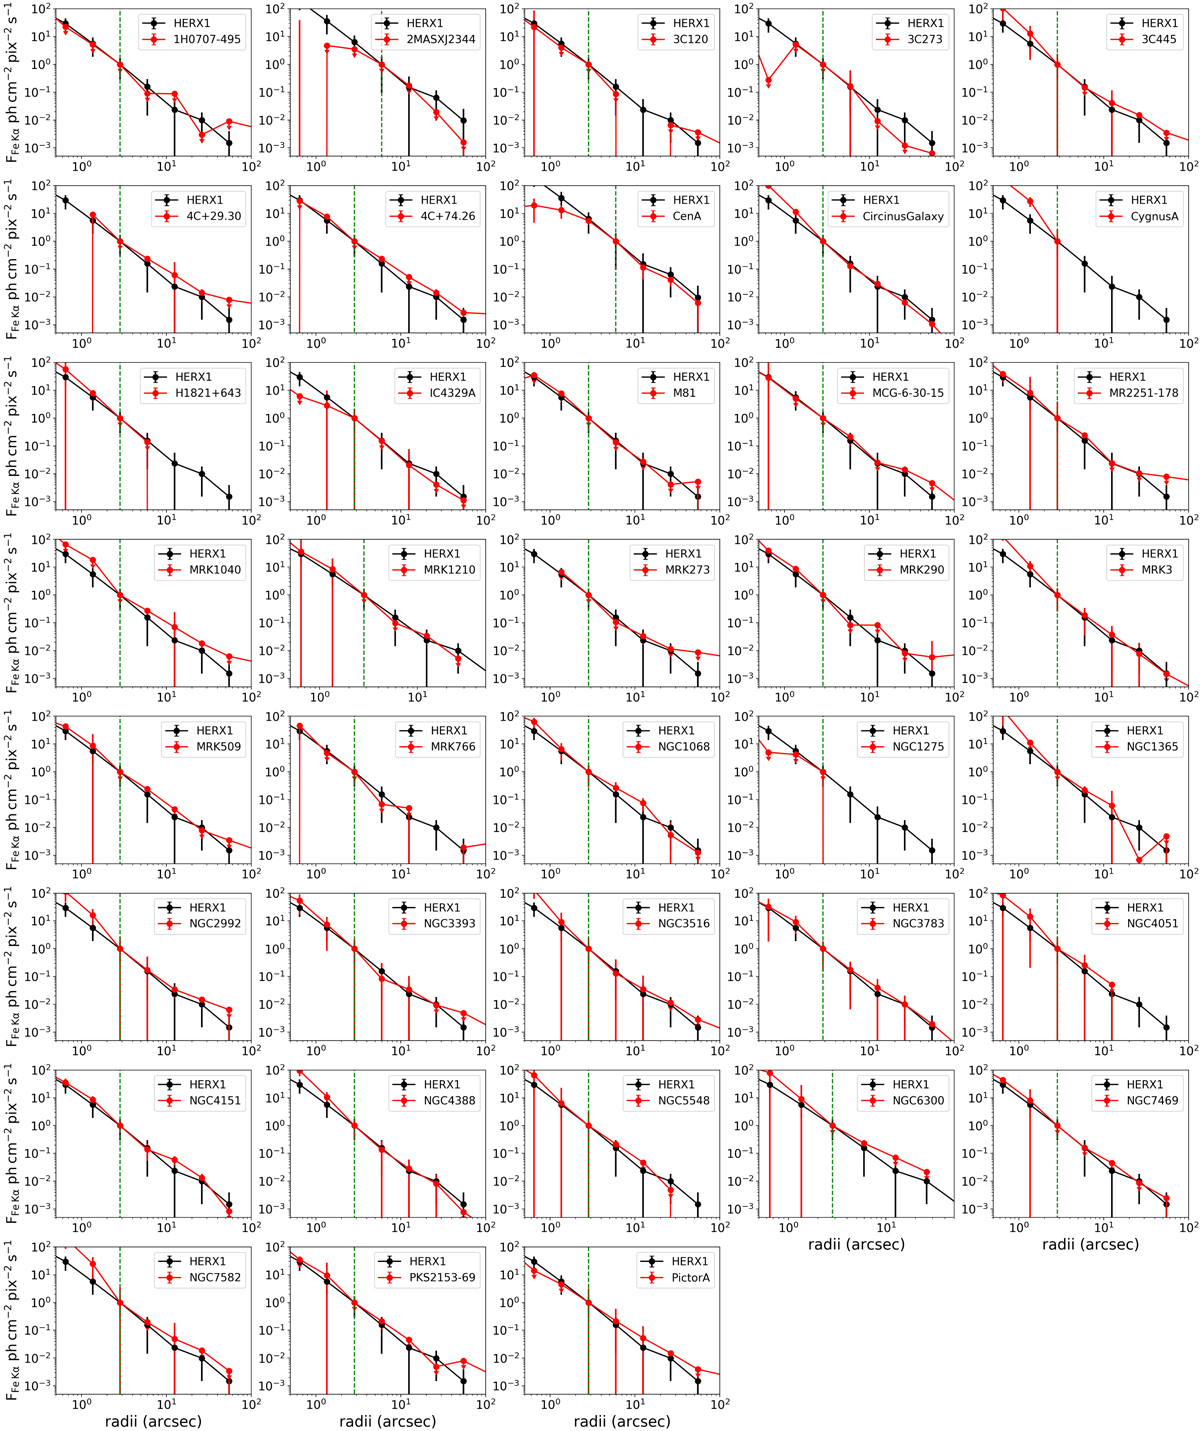
Fig. F.2.
Download original image
Comparison between the Fe Kα radial profile of HERX1 (black) and all the sources in the sample (red). The green dotted line on each plot represents the renormalization radius (i.e., pileup-free radius), which is 2![]() 5 for all the sources except Cen A and 2MASXJ23444, where we adopt 4″. The errors plotted are 99.987% confidence.
5 for all the sources except Cen A and 2MASXJ23444, where we adopt 4″. The errors plotted are 99.987% confidence.
Current usage metrics show cumulative count of Article Views (full-text article views including HTML views, PDF and ePub downloads, according to the available data) and Abstracts Views on Vision4Press platform.
Data correspond to usage on the plateform after 2015. The current usage metrics is available 48-96 hours after online publication and is updated daily on week days.
Initial download of the metrics may take a while.