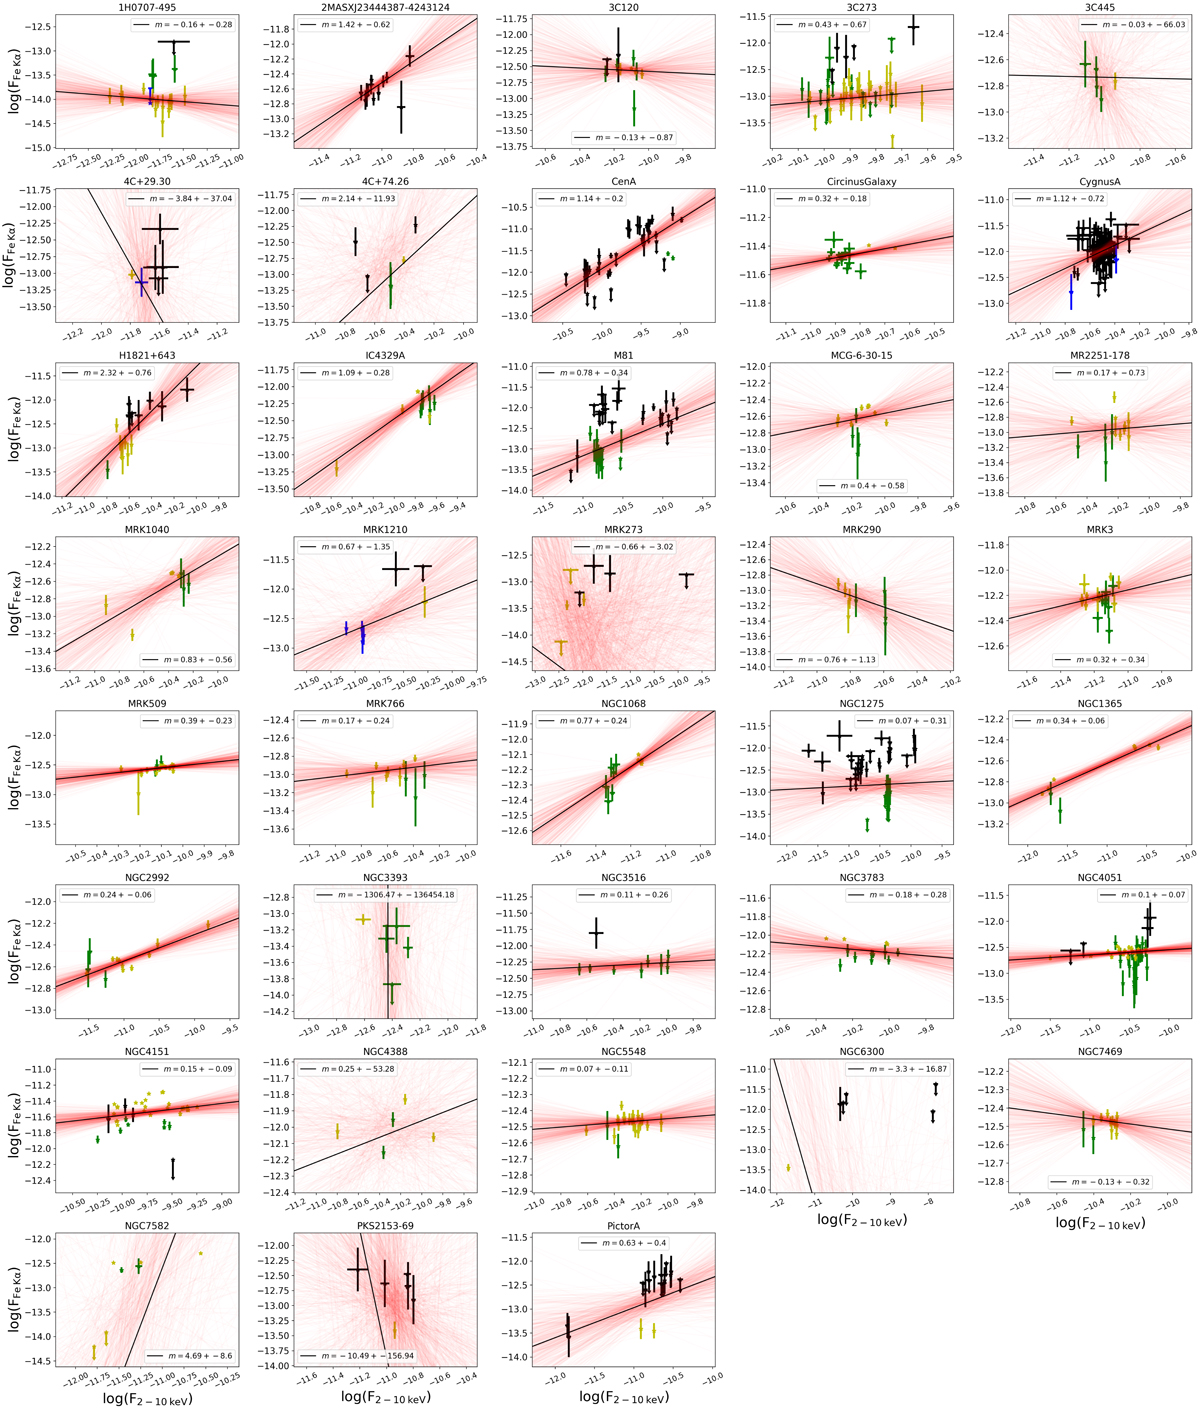
Fig. D.3.
Download original image
Comparison between Fe Kα line (F6.4 keV) and 2–10 keV continuum (F2−10 keV) fluxes, for all sources in our sample. In each subplot, green stars denote Chandra HEG spectra, black stars denote Chandra ACIS 3″-5″ annular spectra, blue stars denote 1.5″ circular Chandra ACIS spectra, and yellow stars denote XMM-Newton pn spectra. The thick red line shows the best-fit linear regression, while thin red lines represent fits from Monte Carlo resampling to demonstrate uncertainties; the best-fit slope and error are indicated in the legend of each plot. Fits to sources with fewer than five measurements in both fluxes are often poorly constrained. The values for the slopes are reported in the label of each plot. The flux units are erg cm−2 s−1.
Current usage metrics show cumulative count of Article Views (full-text article views including HTML views, PDF and ePub downloads, according to the available data) and Abstracts Views on Vision4Press platform.
Data correspond to usage on the plateform after 2015. The current usage metrics is available 48-96 hours after online publication and is updated daily on week days.
Initial download of the metrics may take a while.