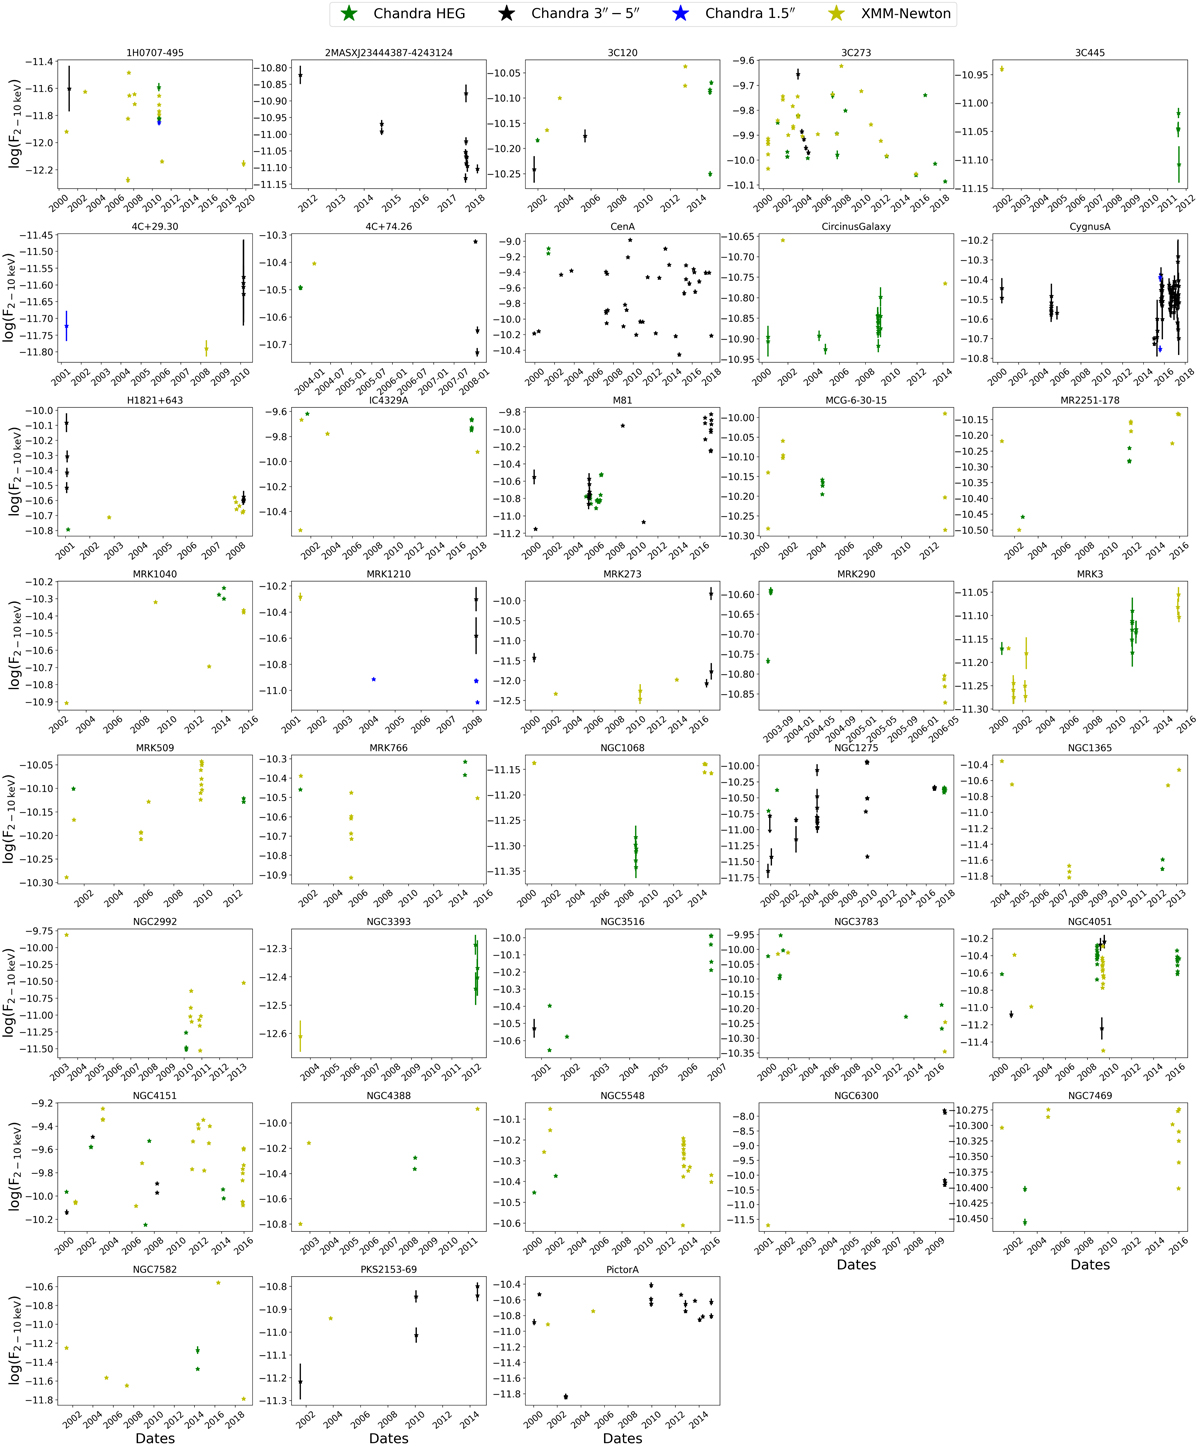
Fig. D.1.
Download original image
Light curves for the 2–10 keV continuum flux (F2−10 keV) for all sources in the sample. In each subplot, green stars denote Chandra HEG spectra, black stars denote Chandra ACIS 3″-5″ annular spectra, blue stars denote 1.5″ circular Chandra ACIS spectra, and yellow stars denote XMM-Newton pn spectra. The units of the flux are erg cm−2 s−1.
Current usage metrics show cumulative count of Article Views (full-text article views including HTML views, PDF and ePub downloads, according to the available data) and Abstracts Views on Vision4Press platform.
Data correspond to usage on the plateform after 2015. The current usage metrics is available 48-96 hours after online publication and is updated daily on week days.
Initial download of the metrics may take a while.