Fig. 12.
Download original image
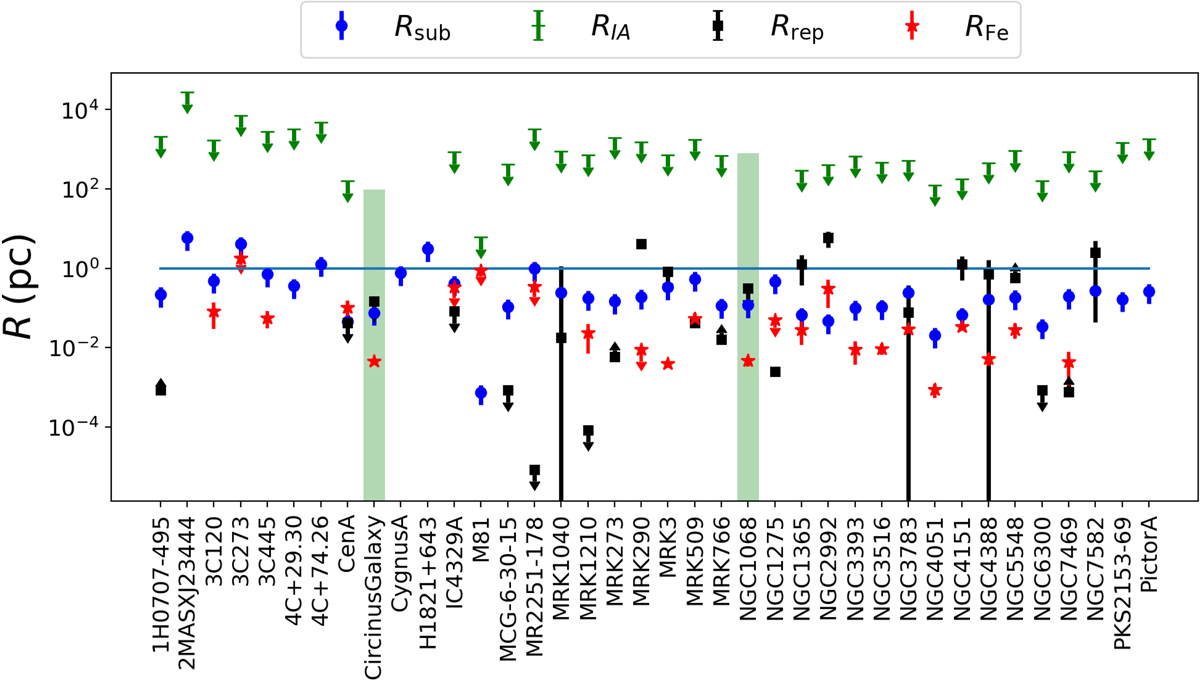
Summary of the reprocessor size estimations computed through the spectral analysis (red stars/limits), the timing analysis (black squares/limits), and the imaging analysis (green lines/limits). The dust sublimation radius Rsub is plotted in blue as a reference. Black squares without errorbars are sources where the simulations could not provide upper or lower limits for the size of the reflector. The green shaded areas in Circinus and NGC 1068 represent the extent of the extended emission that we observe in the imaging analysis.
Current usage metrics show cumulative count of Article Views (full-text article views including HTML views, PDF and ePub downloads, according to the available data) and Abstracts Views on Vision4Press platform.
Data correspond to usage on the plateform after 2015. The current usage metrics is available 48-96 hours after online publication and is updated daily on week days.
Initial download of the metrics may take a while.