Fig. 9

Download original image
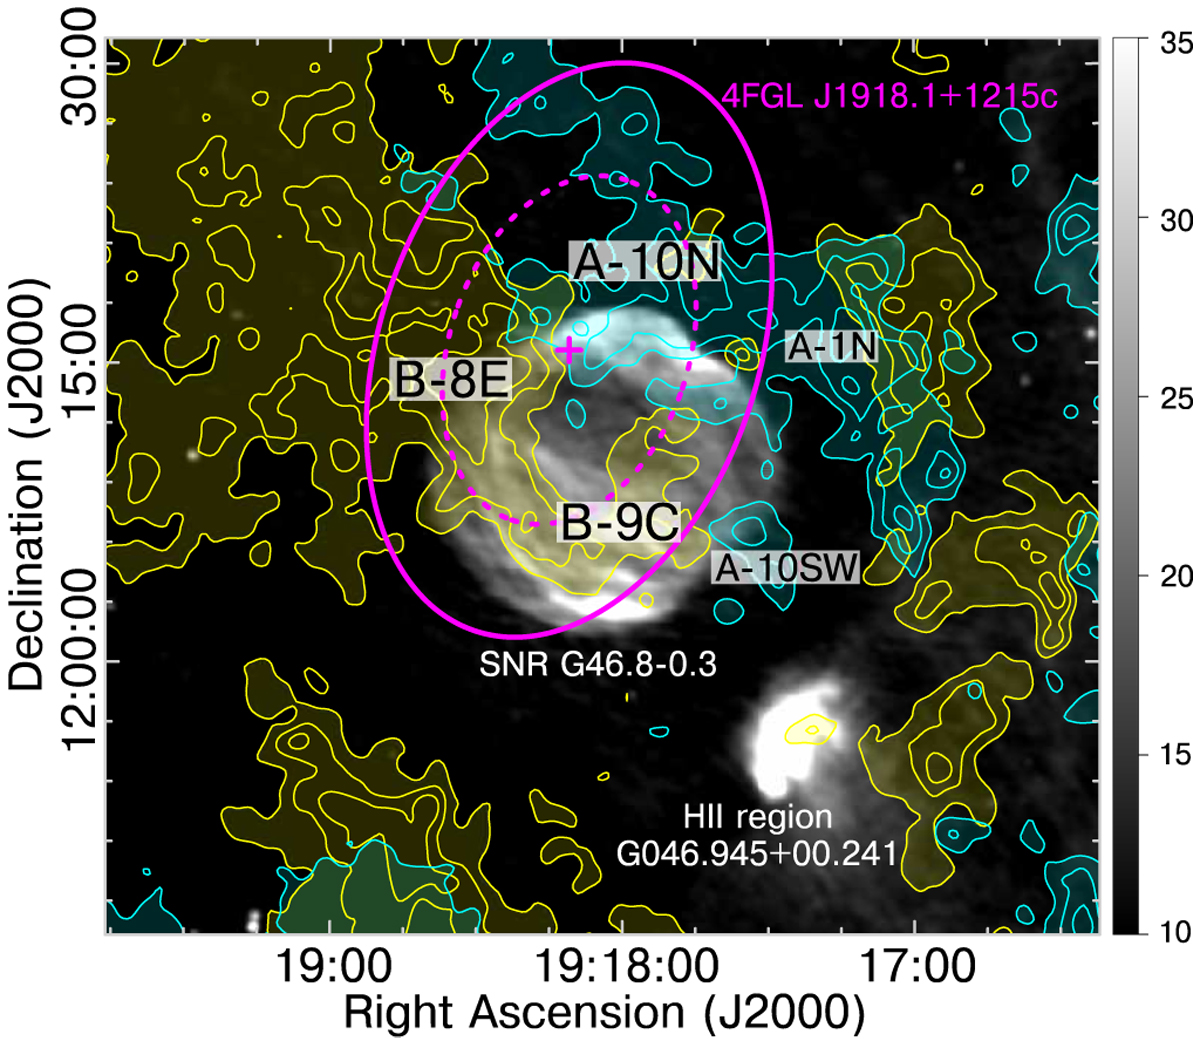
Grey-scale image (in mJy beam−1) corresponding to the radio continuum emission from the shell of G46.8–0.3 overlaid with the 12CO (J = 1–0) line emission from Regions A (in cyan, Δυ = 10–30 km s−1, levels: 40, 70, 100 K km s−1) and B (in yellow, Δυ = 30–50 km s−1, levels: 55, 80, 105 K km s−1) around the SNR. The velocity range of the plotted clouds is the same as in Fig. 7. The plus symbol and ellipses illustrate the best localisation and the 95%/68% confidence contours of the γ-ray emission detected by Fermi-LAT. The enclosed molecular areas corresponding to the A-10N, B-8E, and B-9C clouds were used in Sect. 6 to calculate the total proton content.
Current usage metrics show cumulative count of Article Views (full-text article views including HTML views, PDF and ePub downloads, according to the available data) and Abstracts Views on Vision4Press platform.
Data correspond to usage on the plateform after 2015. The current usage metrics is available 48-96 hours after online publication and is updated daily on week days.
Initial download of the metrics may take a while.


