Fig. 8

Download original image
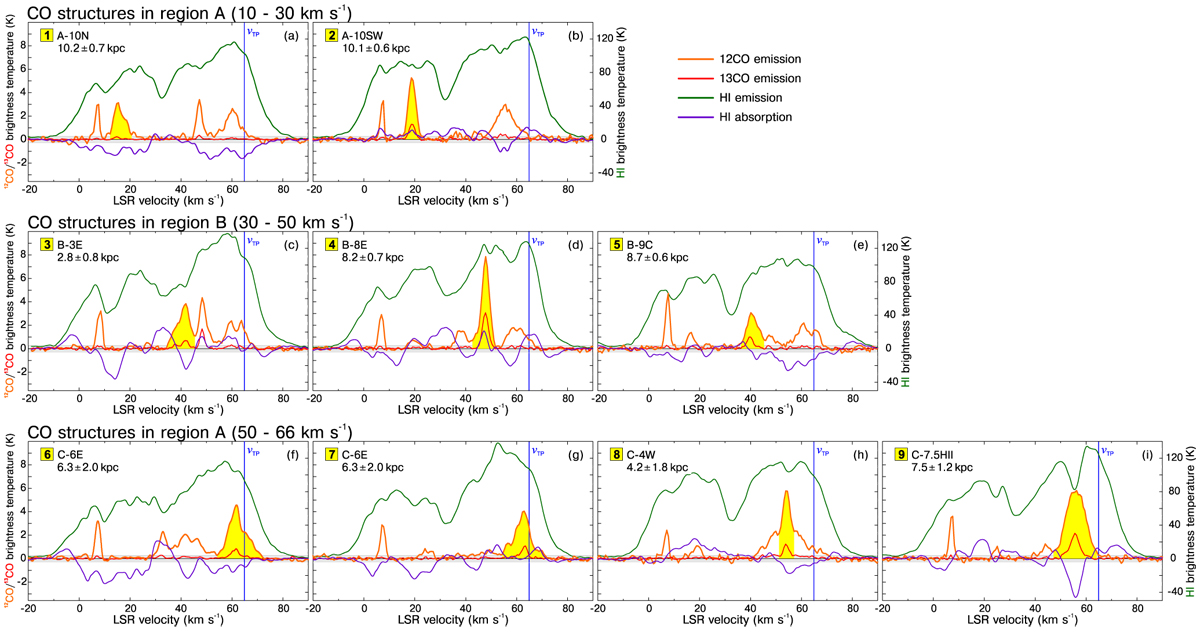
Collection of composite spectra of the CO (j = 1–0) and H i 21 cm line emissions towards test areas over the molecular structures discovered in the direction of SNR G46.8–0.3, as shown in Fig. 7. The correspondences between the molecular and atomic emissions were used to determine the kinematic distance to individual clouds (see analysis in Sect. 5.2). The shaded zones in yellow highlight the CO peak and the LSR velocity in the region we are interested in. The blue vertical line in each spectrum indicates the velocity of the tangent point according to the rotation curve model of Reid et al. (2014). For the remaining spectra (not shown here) used in our analysis, we found approximately the same behaviour in each region as that exhibited by the spectra presented here.
Current usage metrics show cumulative count of Article Views (full-text article views including HTML views, PDF and ePub downloads, according to the available data) and Abstracts Views on Vision4Press platform.
Data correspond to usage on the plateform after 2015. The current usage metrics is available 48-96 hours after online publication and is updated daily on week days.
Initial download of the metrics may take a while.


